


What data are in this data portal?
In this portal you will find the most up to date global health data in the areas of maternal, newborn, child and adolescent Health (MNCAH) and ageing. These data can be visualized on charts and maps which you can download. You are also able to export data. Finally, you will find links to other departments within WHO and other UN agencies where additional data and information in specific areas of interest can be found.
Where do the data come from?
The data portal brings together MNCAH and ageing data from a wide variety of sources. This includes the World Health Organization itself, as well as other United Nations organizations such as UNICEF, UN Statistics Division, ILO, and World Bank. Some data are from other trusted non-governmental organizations (NGOs) and public health research organizations.
Within some indicators, individual data values originally come from specific surveys conducted in countries during a specified time period, while data values for other entire indicators draw from a single source. For this reason, this data portal draws a distinction between the data source and the data host. The data host refers to the resource from which the data values displayed on this data portal were accessed; this is often different than the original source of data. The data source specifies the survey or other source for that country for that year for that indicator. This data source is often a Demographic and Health Surveys (DHS), Multiple Indicator Cluster Surveys (MICS) or other national surveys, but the data host may be a resource that compiles data for specific indicators from multiple source, such as UNICEF’s global databases or WHO’s Global Health Observatory (GHO).
How can I find data according to subject area?
In this data portal the indicators are organized according to the larger health themes related to our department. These are: “Maternal & newborn“, “Child“, “Adolescent“, “Ageing“, “Cross-cutting“, “Laws & Policies“ and “Global Strategy for Women’s, Children’s and Adolescents’ Health“. These health themes are used throughout the portal for organizing and for searching for data.
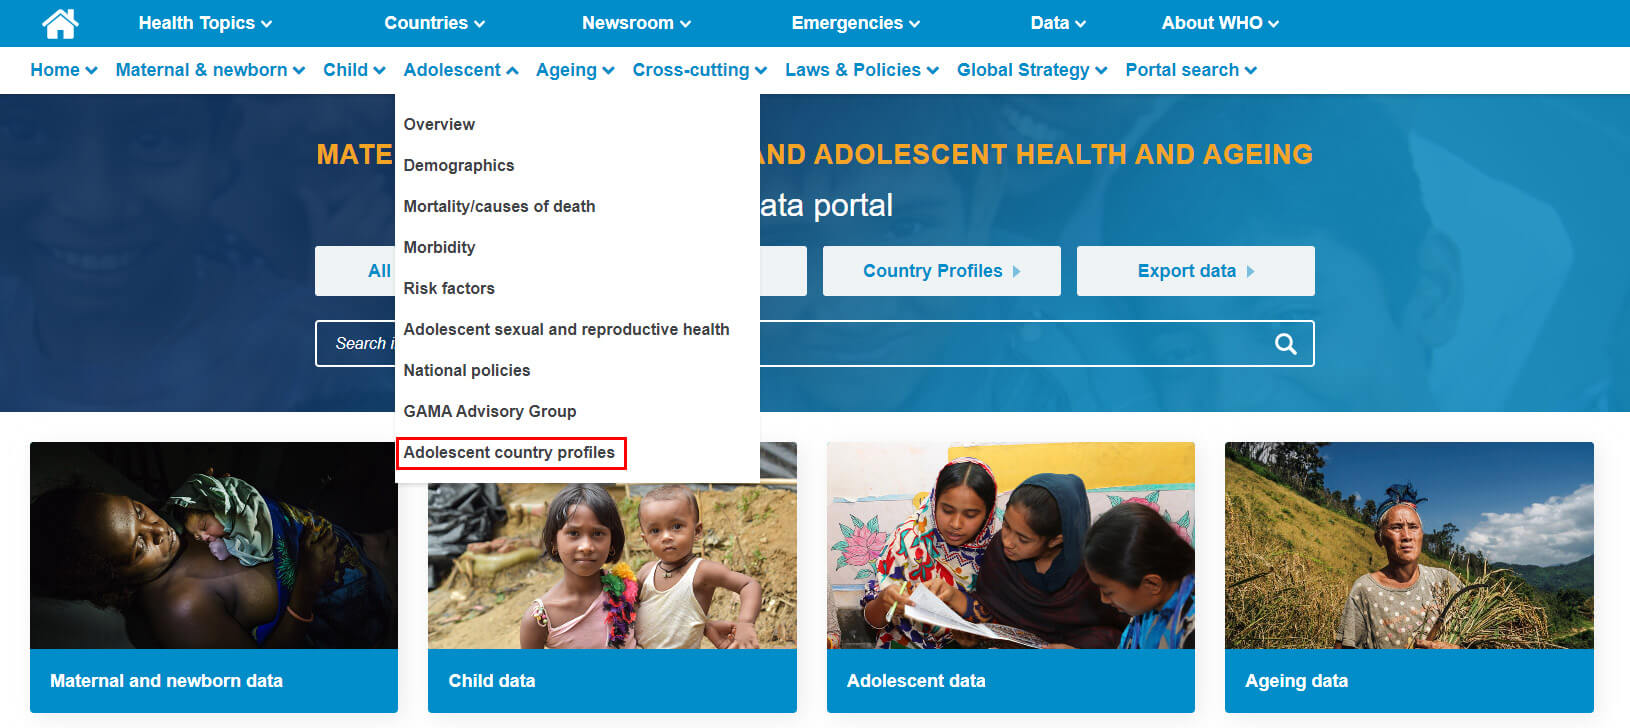
If you are interested in a specific health theme, then these sections should be your starting point. Each health theme has an “overview” page that describes the health theme and provides more related resources as well as the health topics and indicators that pertain to the health theme. These health themes are displayed in the navigation bars that appear on the top of ever page in the data portal. For example, in the screenshot below the adolescent health theme is highlighted:

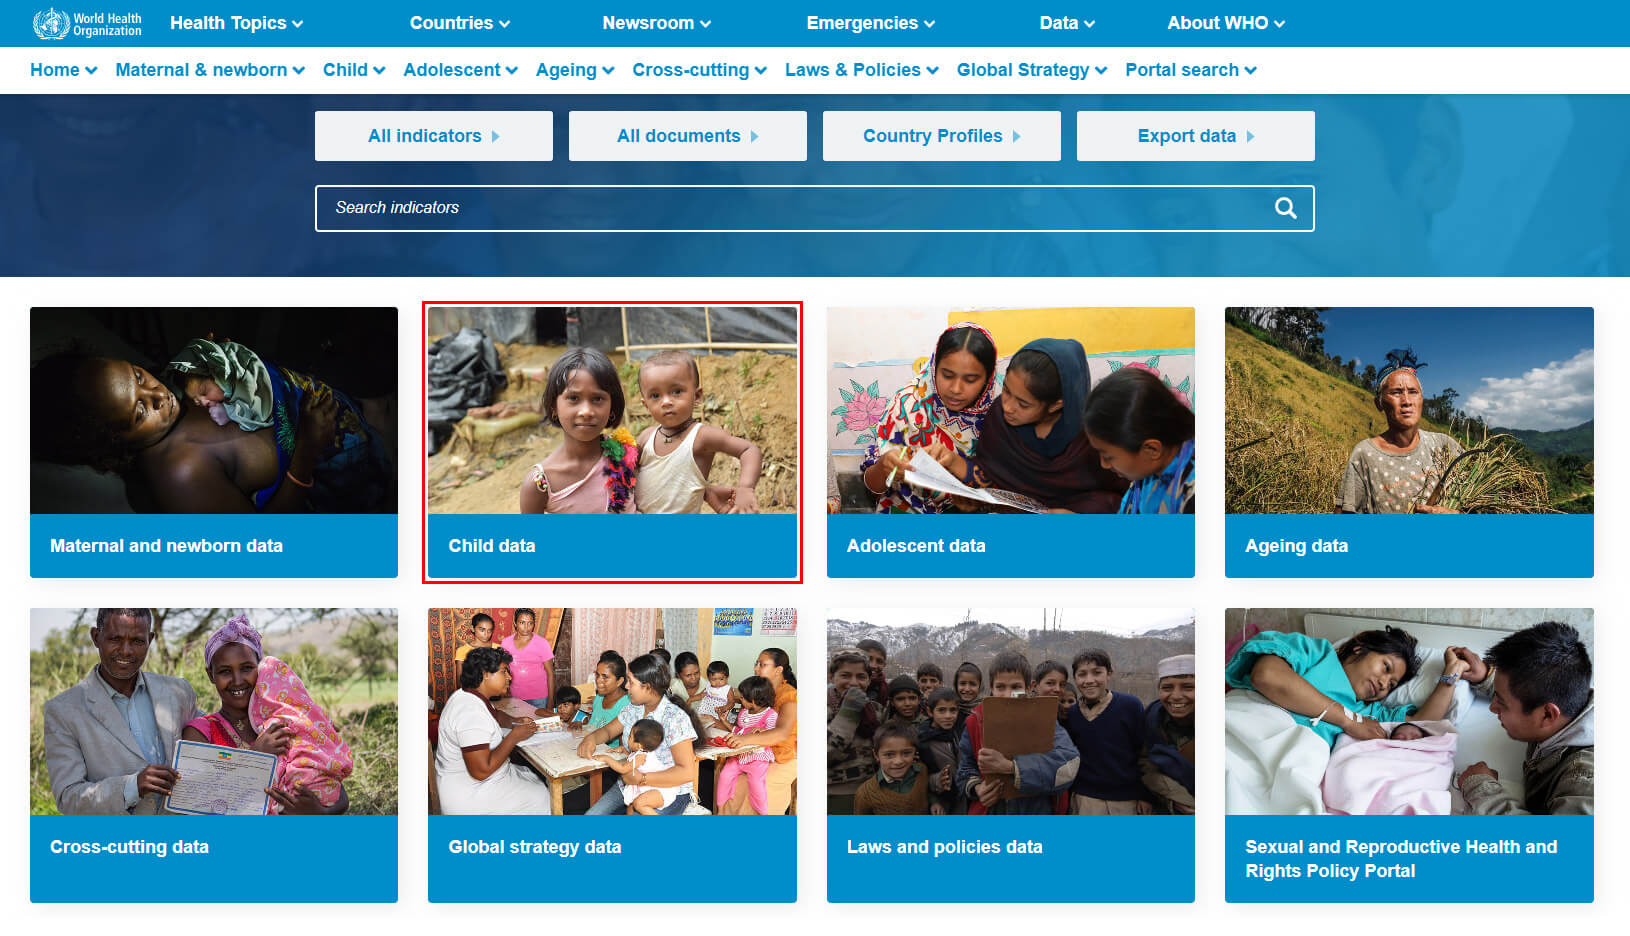
You can also access these themes through navigation tiles on our home page.You may click any of these tiles for more information and to see the associated health topics, documents, and other resources relevant to various health themes. For example, in the screenshot below, the highlighted tile below leads to the child health data and related resources in the portal.
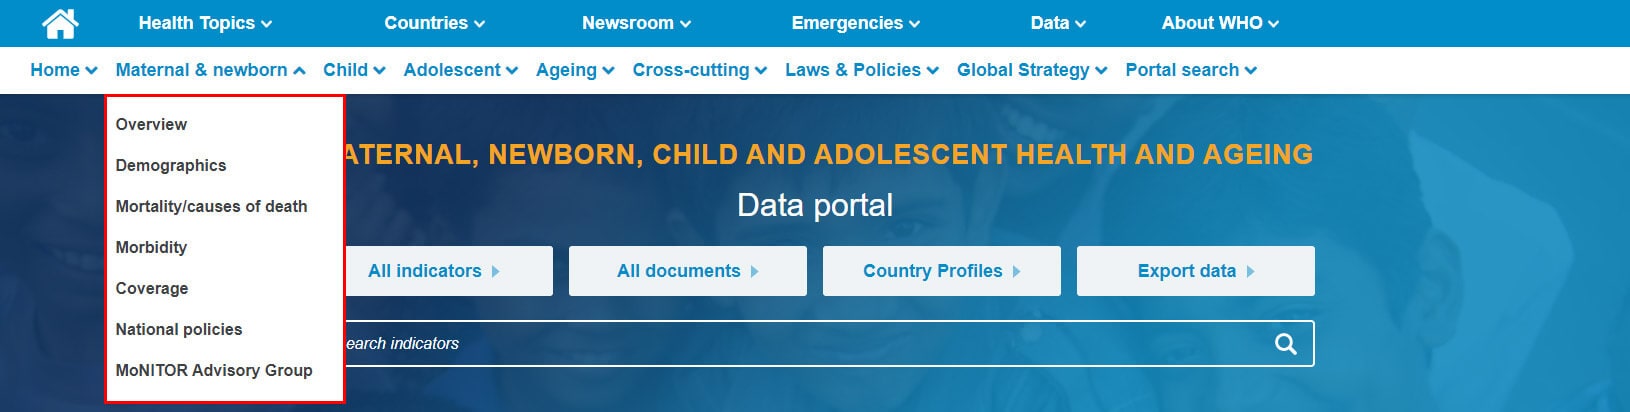
Each of our health themes is further categorized into smaller health topics, which include, but are not limited to: “Demographics“, “Mortality/causes of Death“, “Morbidity“, “Coverage“, “National policies“ . These health topics are used throughout the portal for organizing and for searching for data.
These health topics are found in the dropdown navigation menus like this:
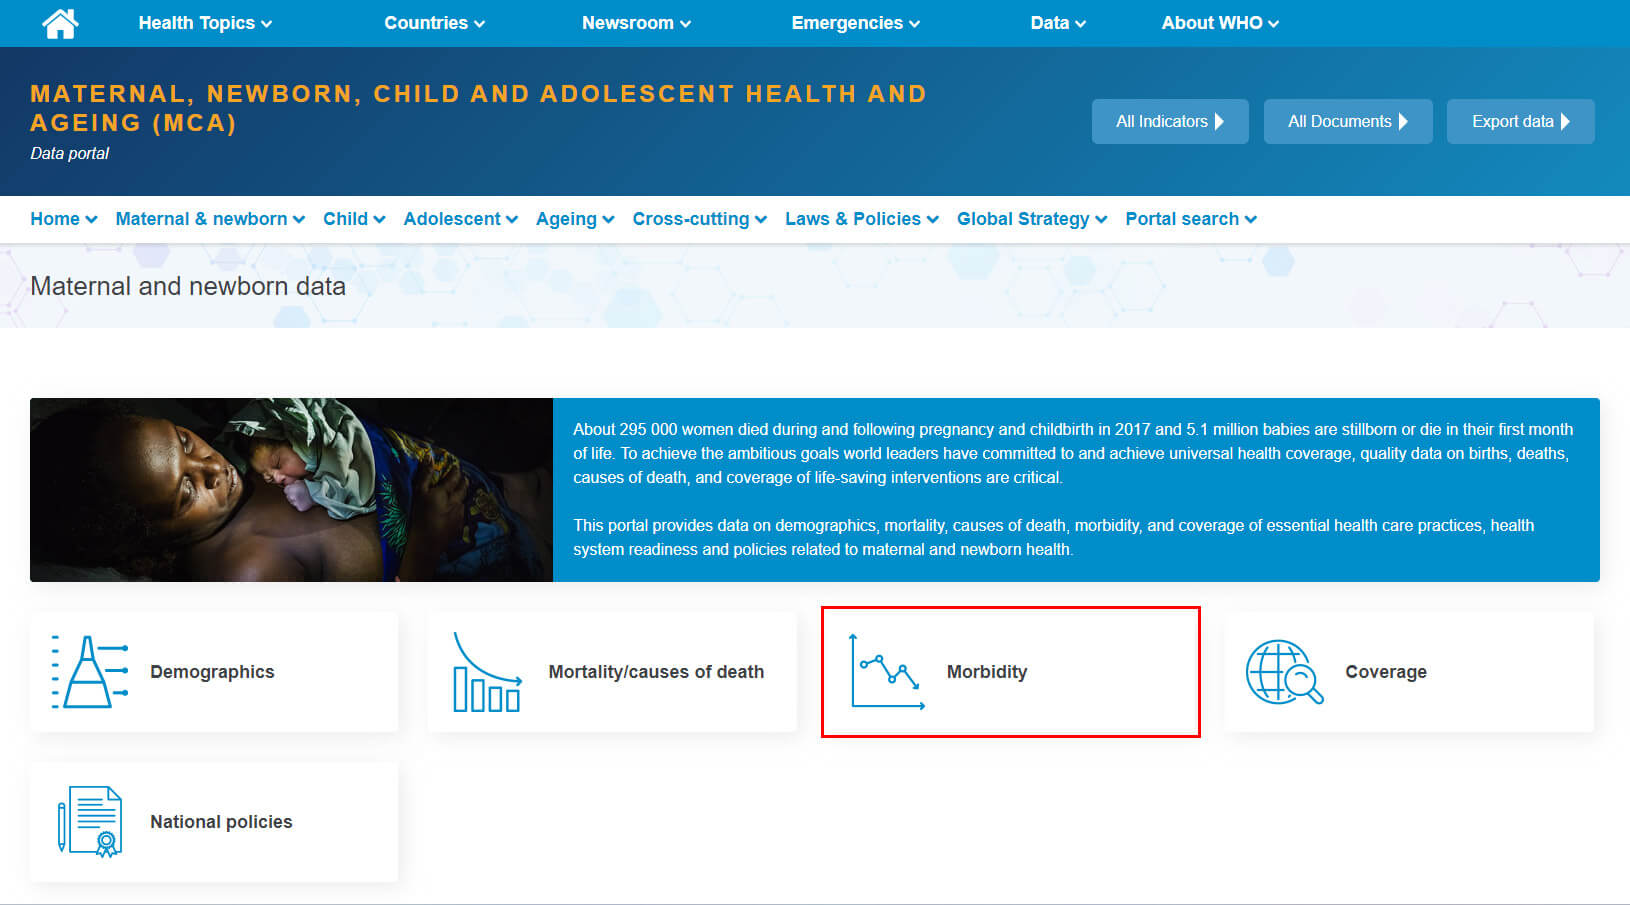
The health topics can also be found on each of the health themes’ overview pages. In the example below the highlighted tile will lead to the mortality topic.
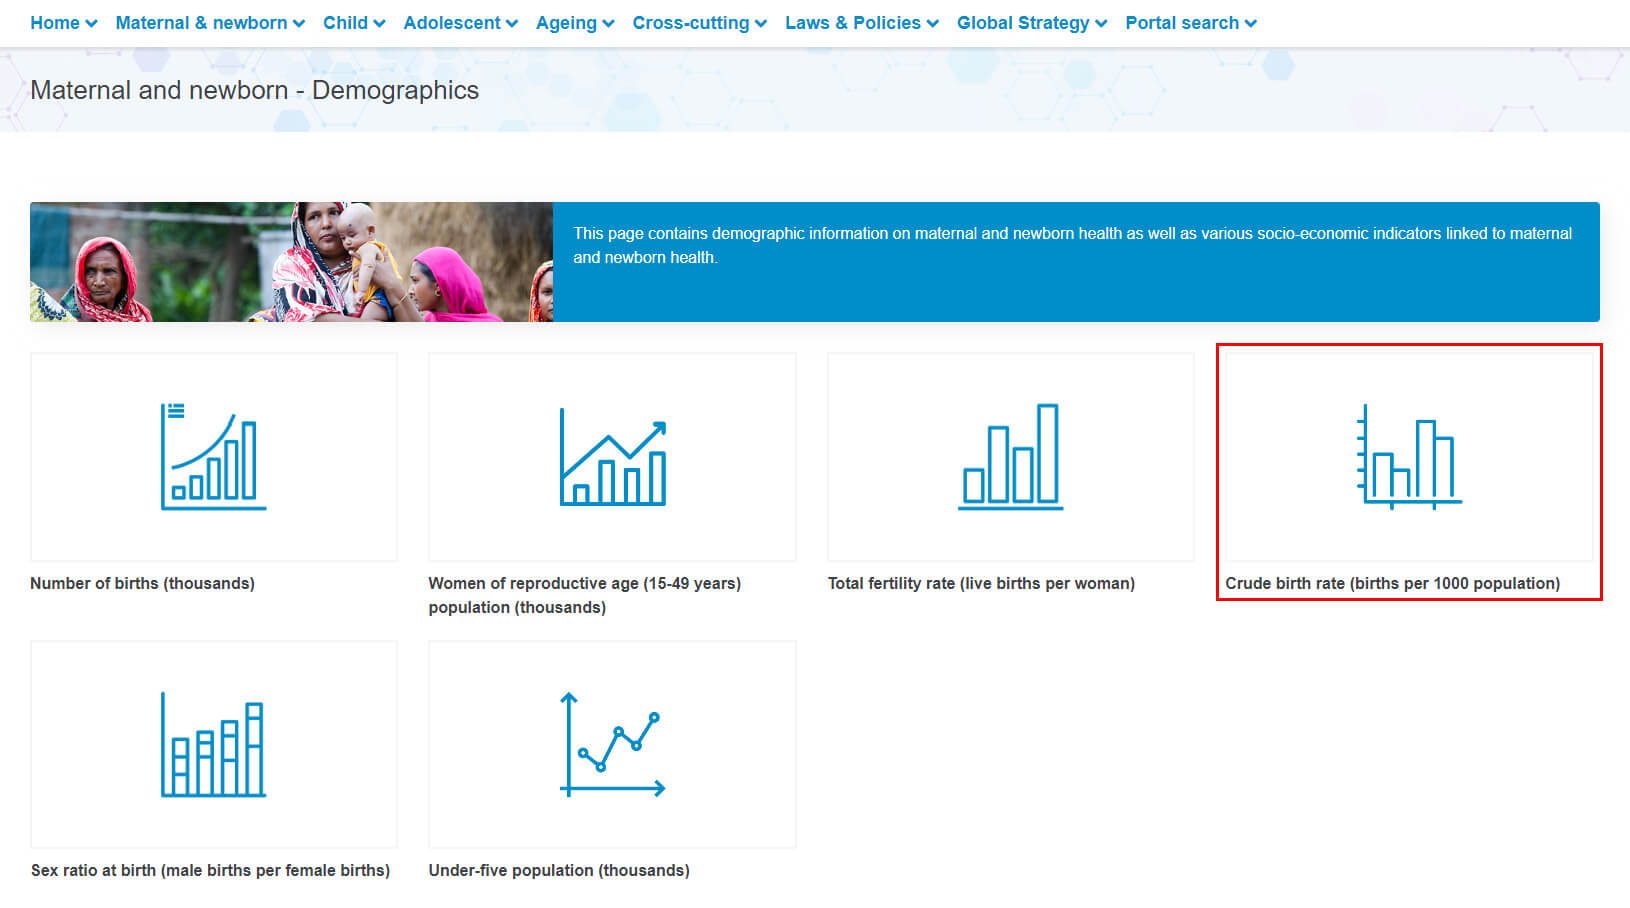
Each of the health topic pages contains tiles that describe the indicators that belong to that health topic. For example, if you are in the maternal & newborn theme’s demographic health topic then you will see the following indicators:
How do I search for data from the home page / main menu?
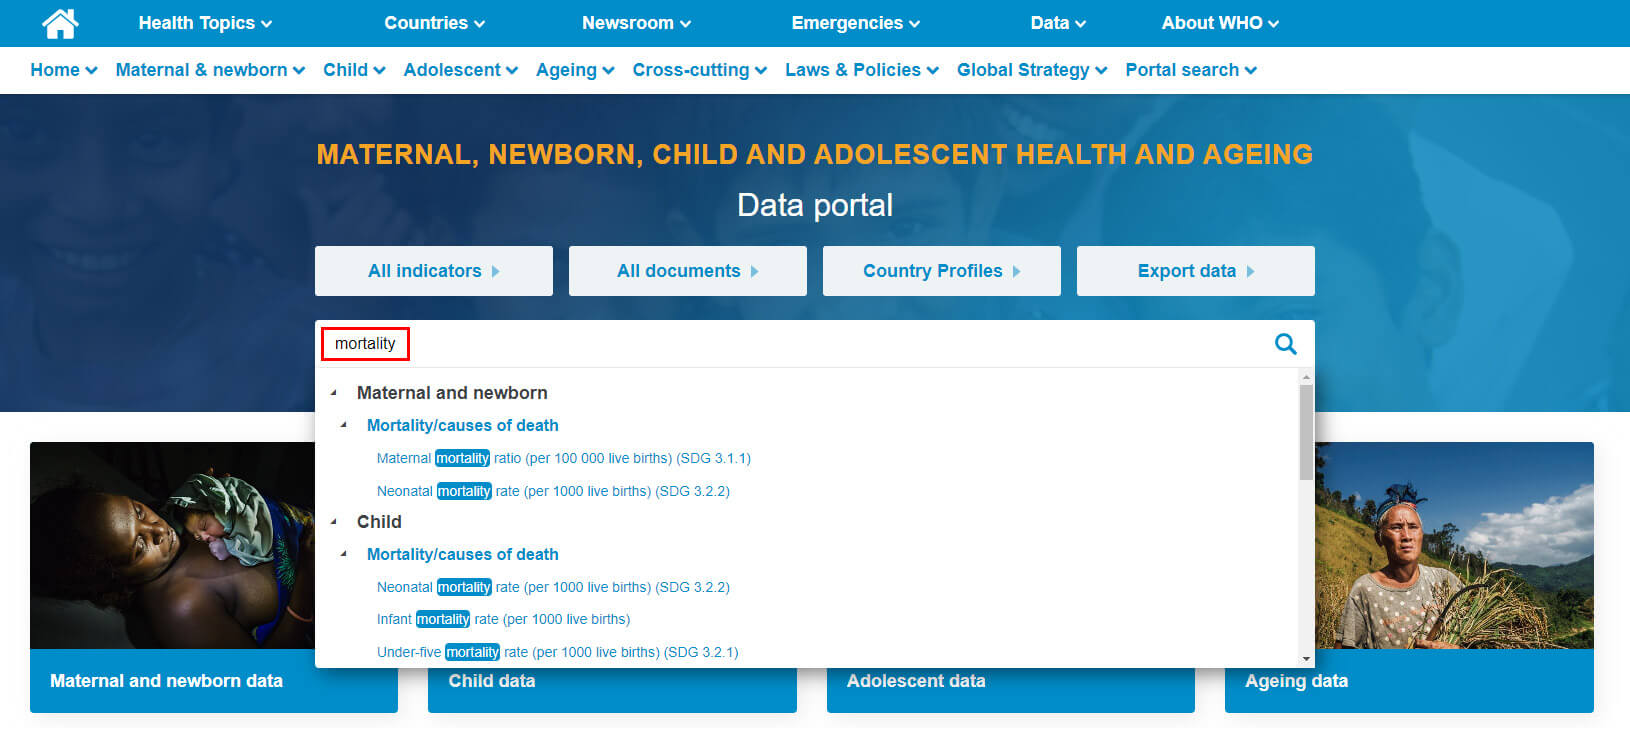
The data portal home page provides several different ways to search for indicators as shown highlighted in red in the image below. This includes the Search indicators box (1), the “All indicators“ button ( 2) and the portal search navigation drop-down menu (3) as shown below. Please see "How do I use the Indicator Search Box?" for more information on how the indicator search box works.
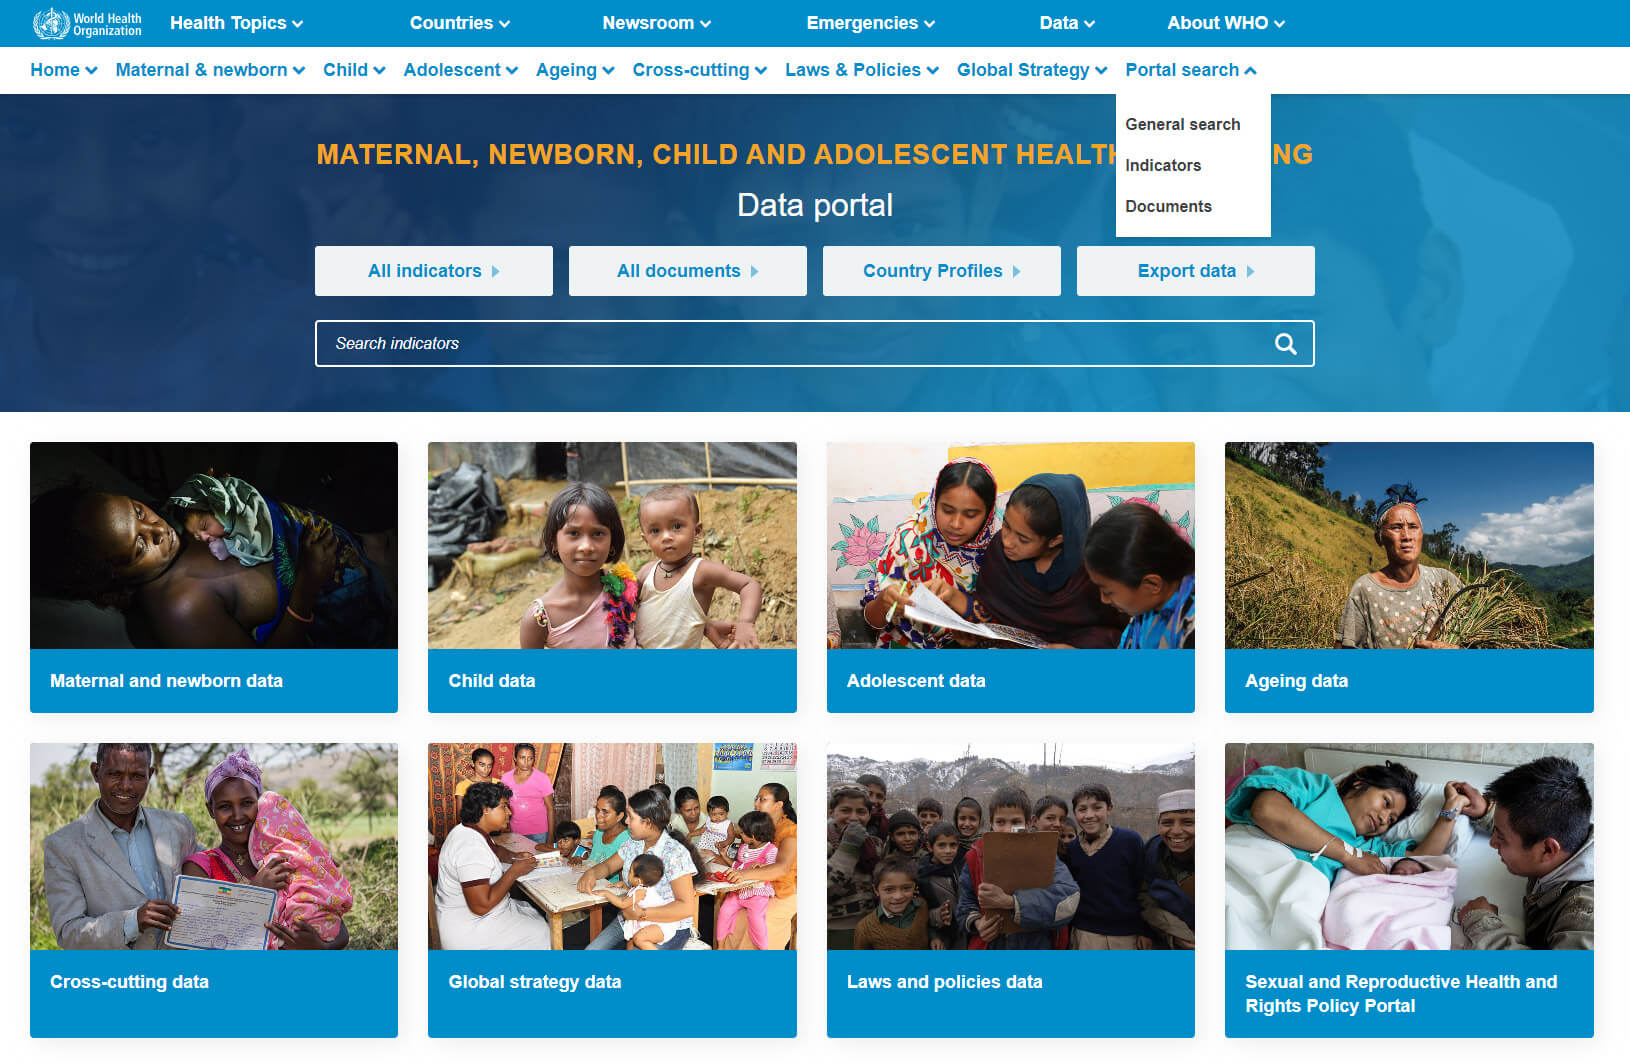
The “Search indicators“ box (1) allows you to search directly from the home page using the search box interface.
The “All indicators“ button (2) and the portal search navigation drop-down menu (3) will send you to the dedicated indicator search page which is a standalone page whose sole function is to search for indicators using the indicator search box as shown below.
How do I search for more data from the indicator data pages?
In order to search for more indicators once you have already entered an indicator data page you can use the blue Indicators Explorer button is present on all of the indicator pages. For example:
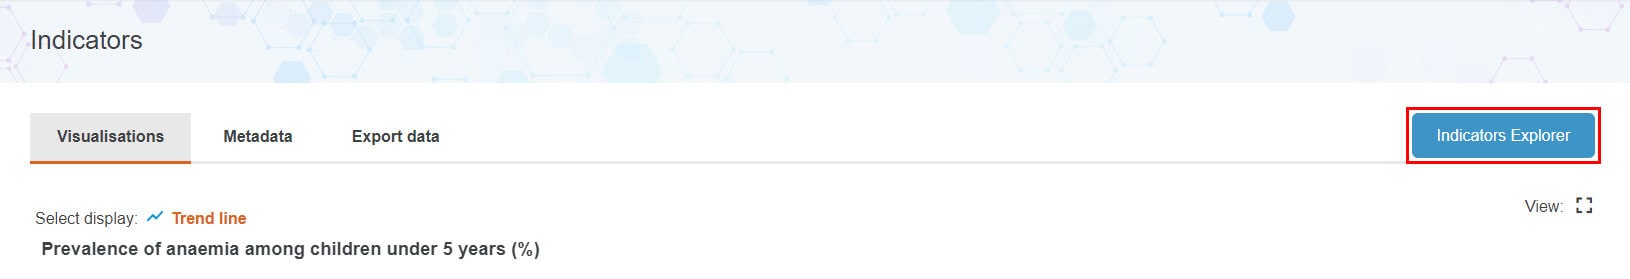
Clicking the blue “Indicators Explorer“ button opens a dialog box that allows the user to find indicators in using the indicator search box. Please see “How do I use the Indicator Search Box?” for more information on how the indicator search box works.
How do I use the indicator search box?
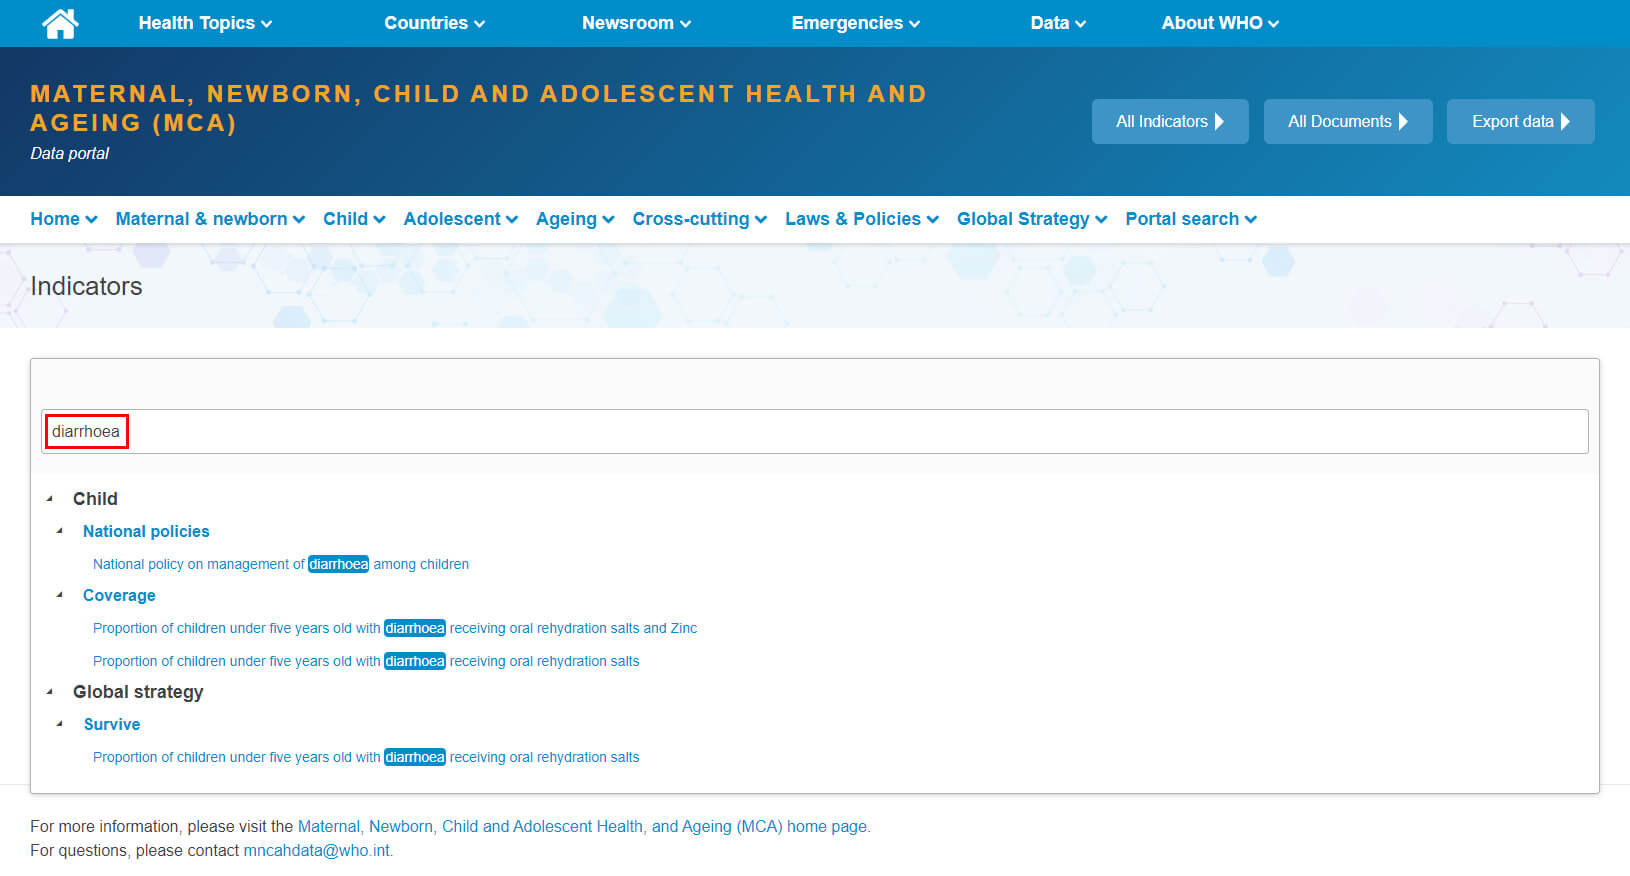
The indicator search box appears in many different locations throughout the data portal but functions essentially the same way in all locations. It allows the user to find indicators in two ways. The first is to simply begin typing a search term which narrows the list of indicators that match the key terms as the user types. Then the user can click the desired indicator to open a dedicated indicator page.
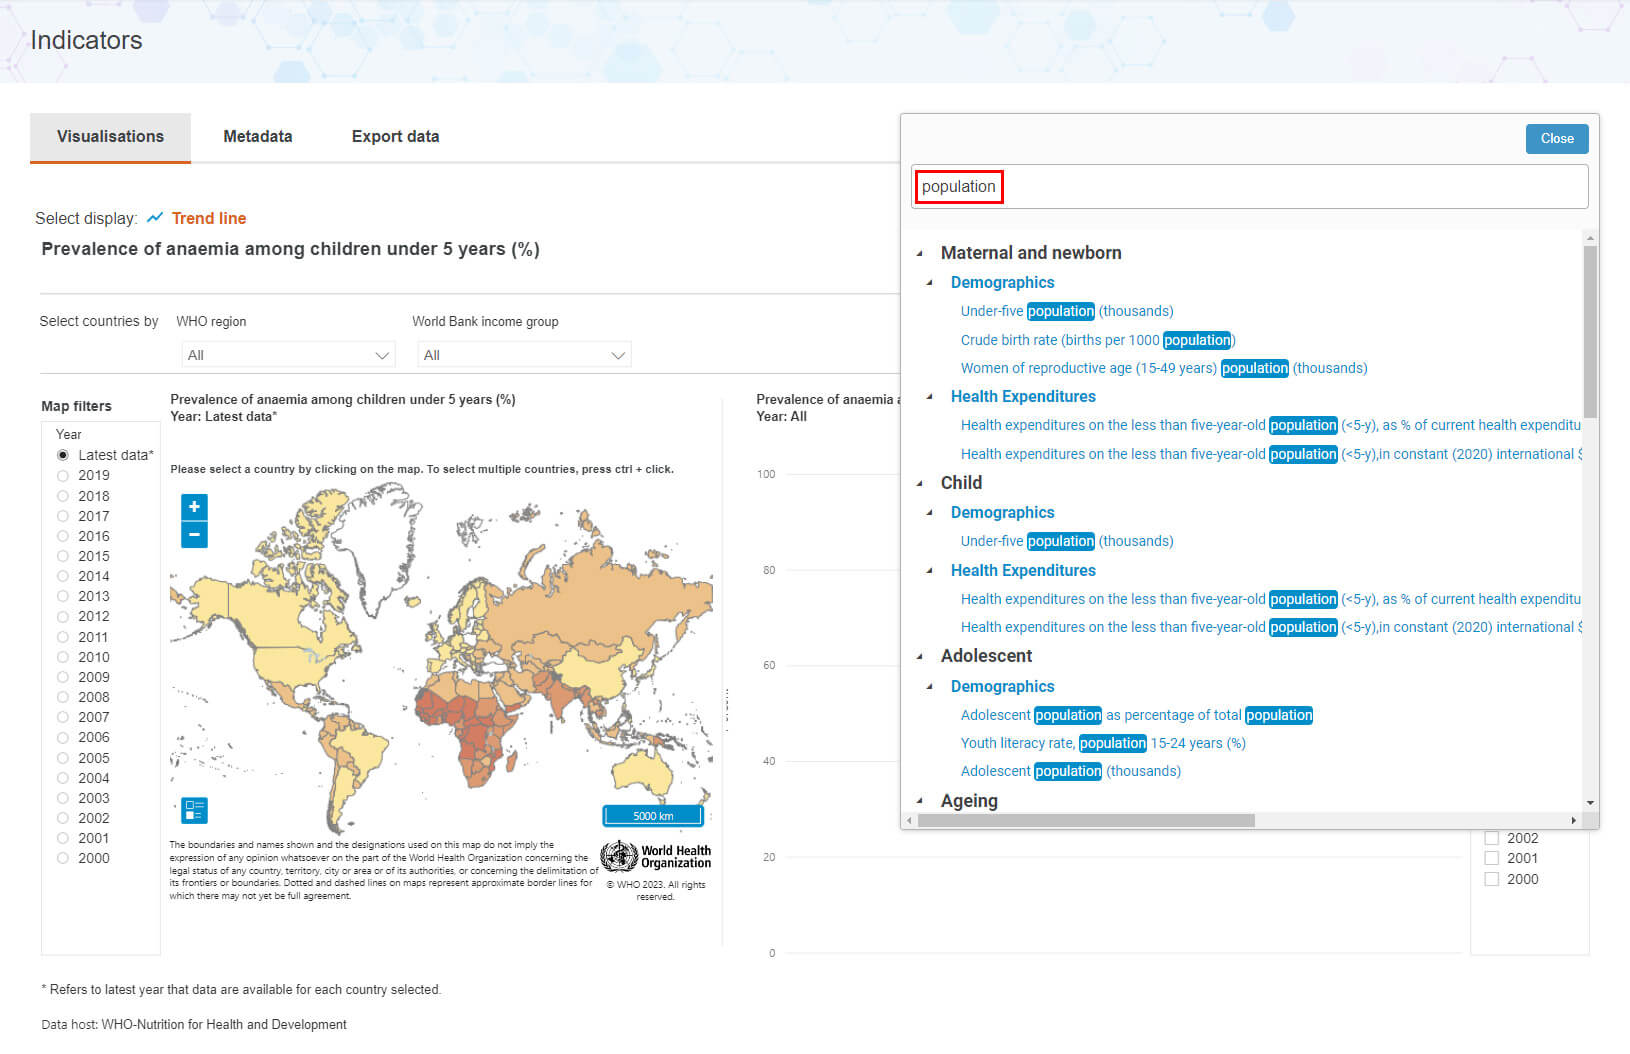
The second approach is to search for indicators under specific themes and topics like this:

How does the indicator data page work?
Once you have selected an indicator using one of the search methods above, a dedicated page with data and visualizations for that indicator will open. This indicator page has a wide variety of functions and elements as shown here:
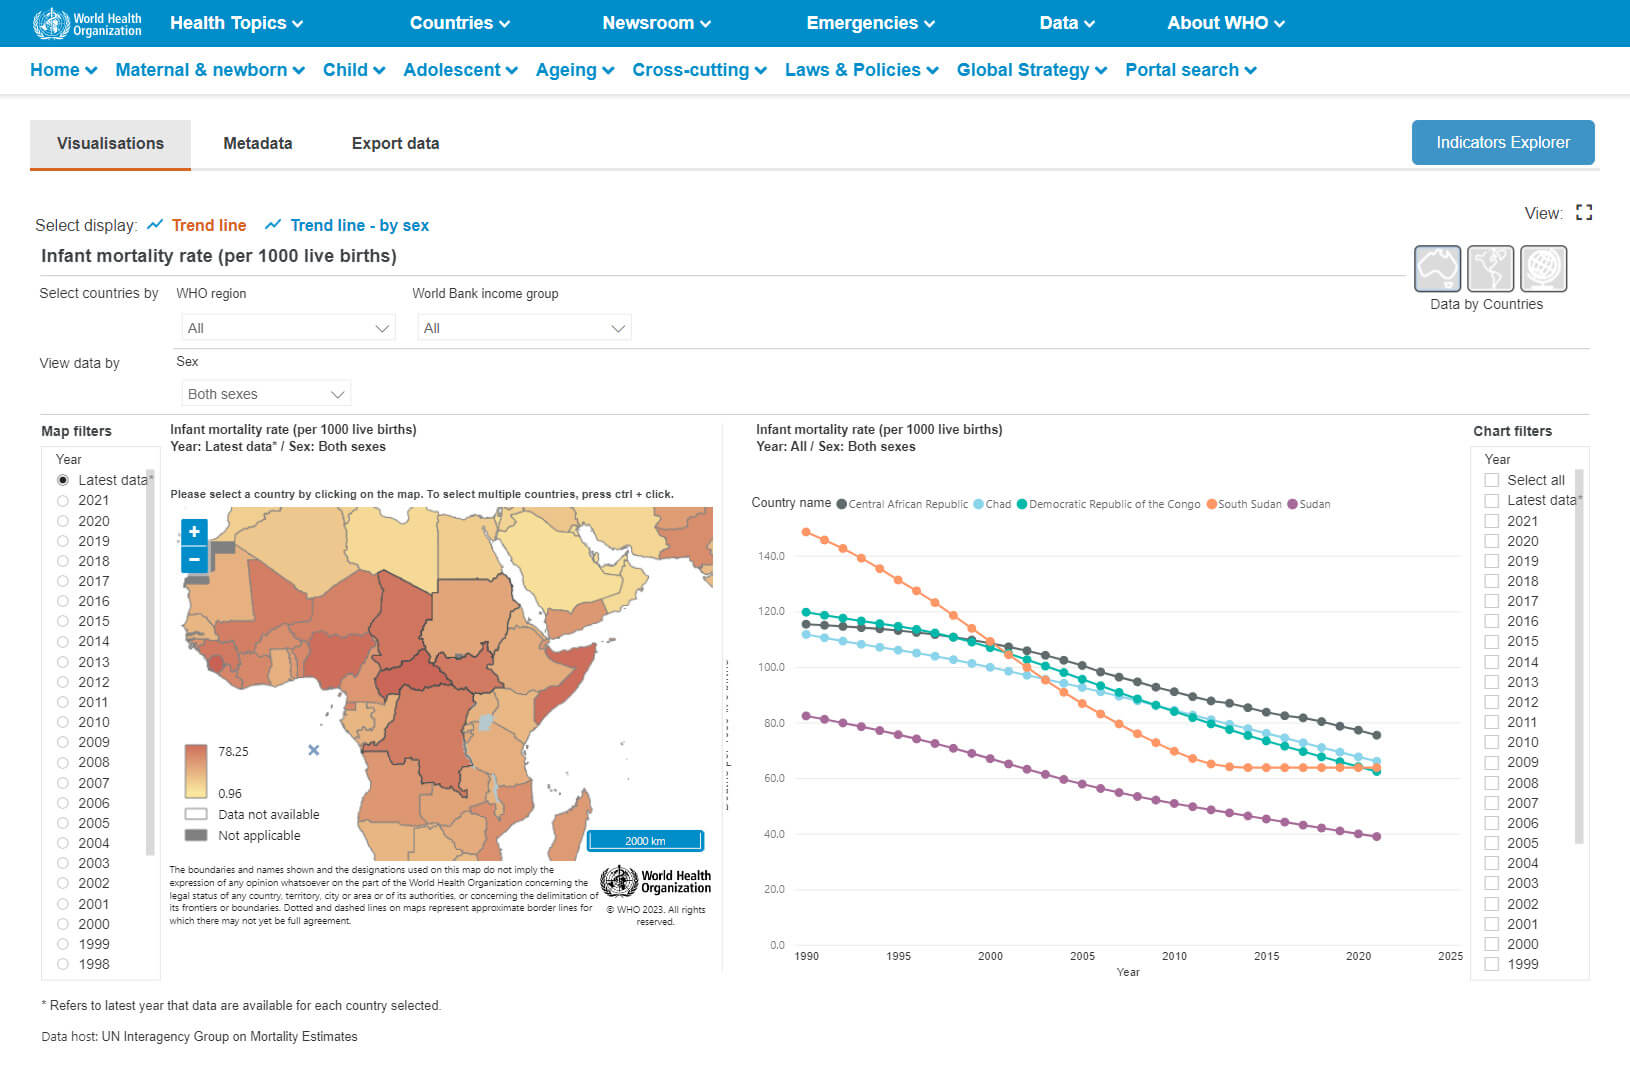
A: Indicators may have more than one way to visualize the data which are called “reports”. If this is the case then you will be able to see these reports listed here. They are generally named descriptively so that you know what kind of visualization of the data will be presented along with the dimension by which the data will be disaggregated. In this case there are two reports: one with a trend line and another with trend lines based on sex. The current selection shows the national value for the both sexes for the indicator.
B: In this area you can select all of the countries in a WHO region or a World Bank income group by using these drop-down menus. They will then be highlighted in the map (E) and at times shown in the chart area (G).
C: Depending on the indicator there may be multiple dimensions such as sex, age group or residence area or many more. You can filter the data along these dimensions using these drop-down menus. In this case the data are filtered by “Both sexes“.
D: Map Filter. The map element is very useful for visualizing data and selecting countries but showing more than one dimension of data or more than one year of data can be difficult. This filter allows you to select a specific year, and at times specific values for dimensions, and show them on the map (E).
E: This map has two purposes: to graphically represent the data as filtered by country (B), data (C) and map (D) filters. The second purpose is to allow for the selection of specific countries. Some indicators allow only a single country to be selected which is accomplished by simply clicking the country desired with your mouse or finger if on mobile device. While others, like this example, allow for multiple countries to be selected which is accomplished by selecting while holding the control or apple command key. In this example four countries have been selected in this manner and the results appear in panel (G).
F: Chart Filter. The chart element (G) can be further filtered by the chart filter. Usually this is useful for reducing the number of years in the visualization.
G: This area contains the visualization of the data as filtered by country (B), data (C) and chart (F) filters. Please use your mouse to further explore the data as there are tooltips in many of the visualizations that will provide more information about the data.
H: Some of the indicators in the data portal contain data that are aggregated at the global level or by WHO Region or by World Bank income groups as well as other aggregations. If this is true for your indicator then you see icons in this corner for global, regional or country level. Clicking them will lead to further reports using the same basic design as the country level data.
How do I learn more about the indicators?
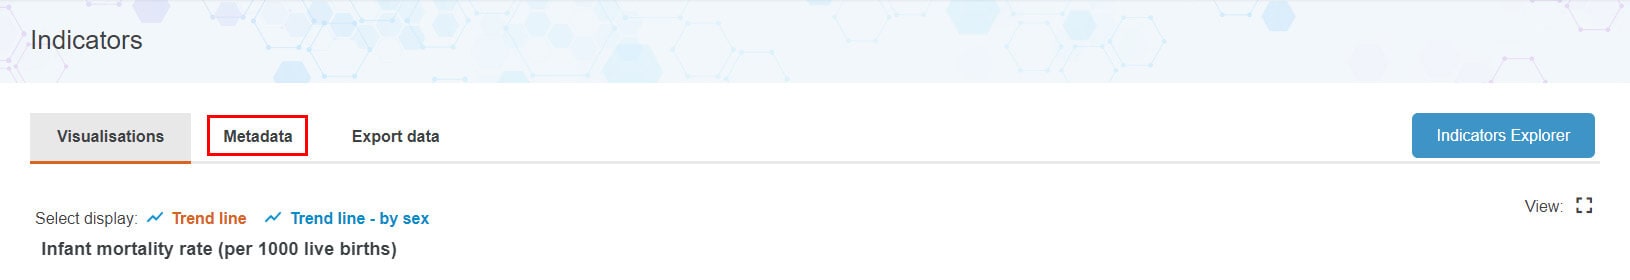
You can find out more information about how the indicator is defined, how data were collected and all other data by looking at the “Metadata” tab of each indicator page. These pages show information from WHO’s Indicator Metadata Registry and provide pertinent information regarding each indicator. Please click the “Metadata” tab as shown in this example:
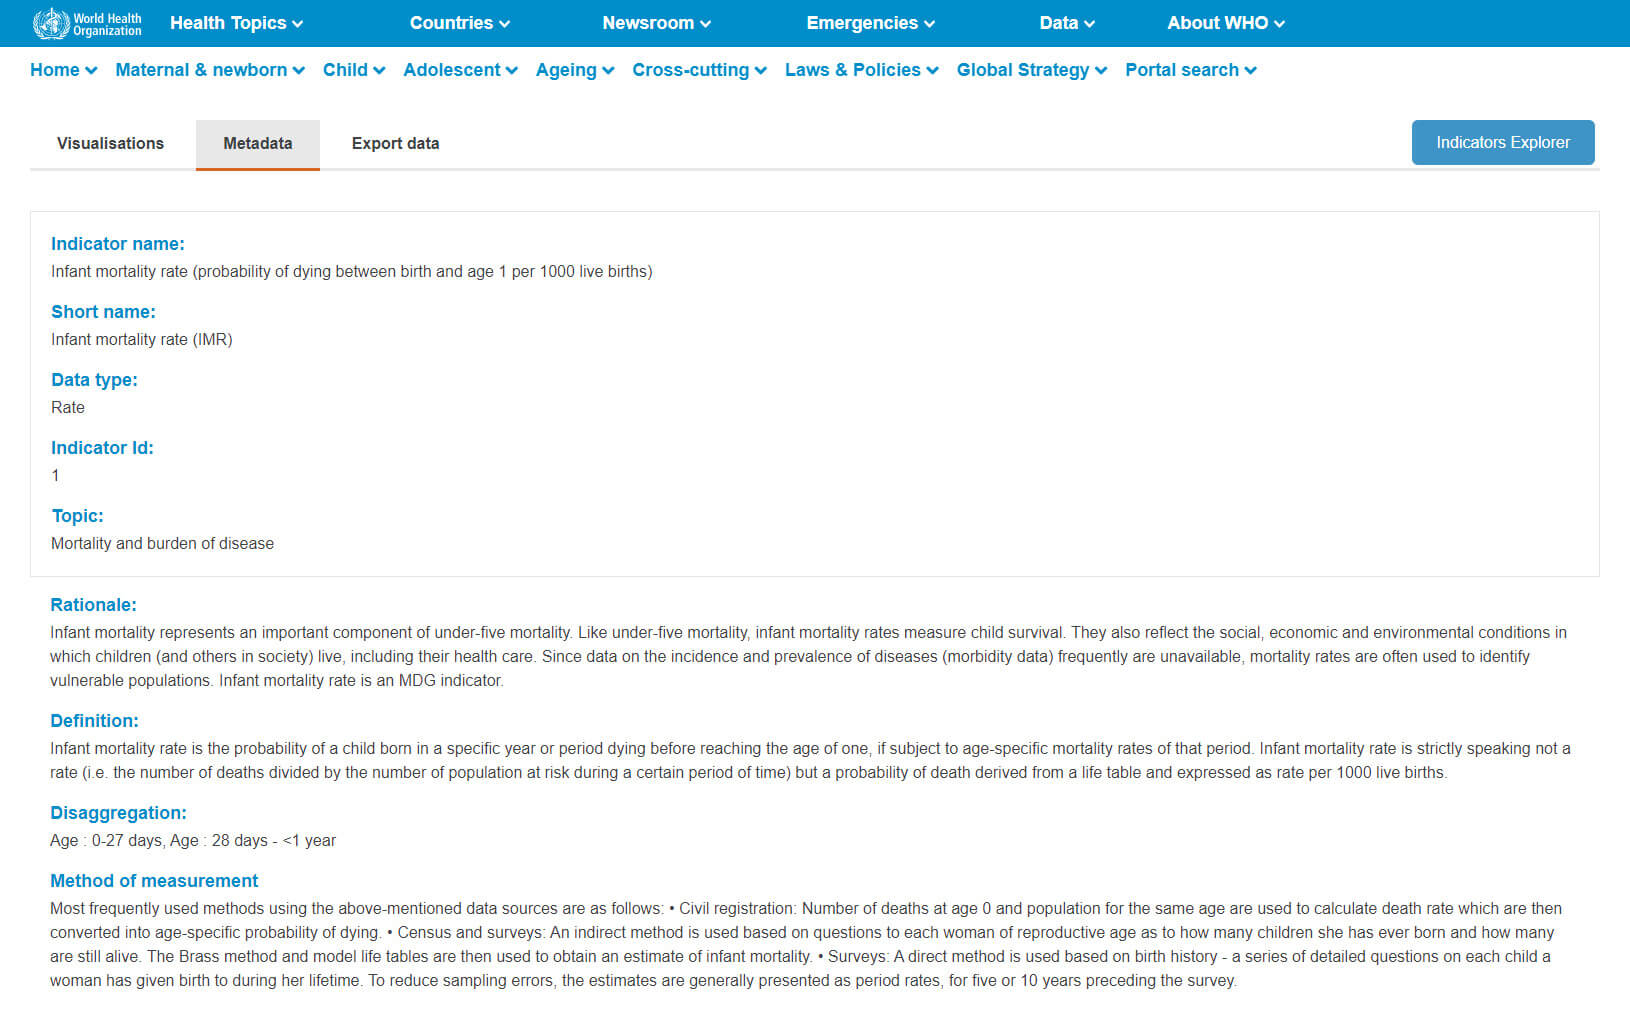
This is an example of the kind of information you will find on each metadata page:
How can I export data?
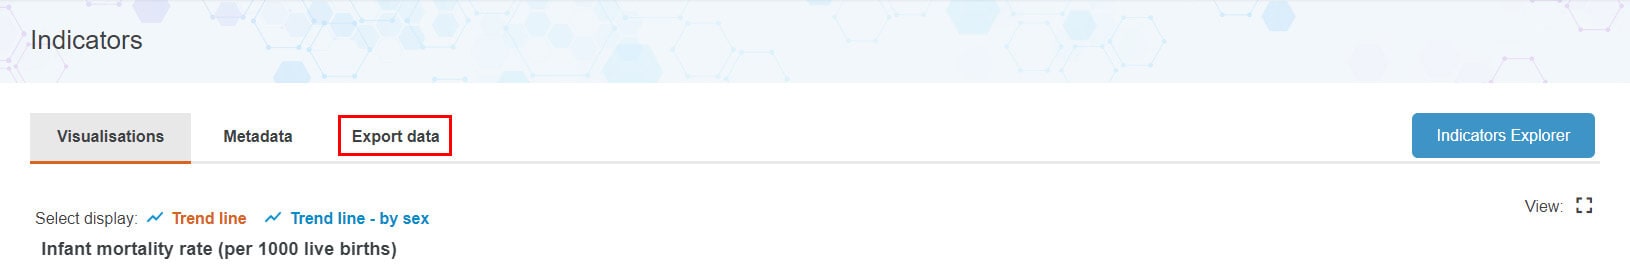
There are two ways you can export data: from the “Export data“ tab of each indicator page or from the dedicated export data page.
You can export data from each indicator page by selecting the “Export data” like this:
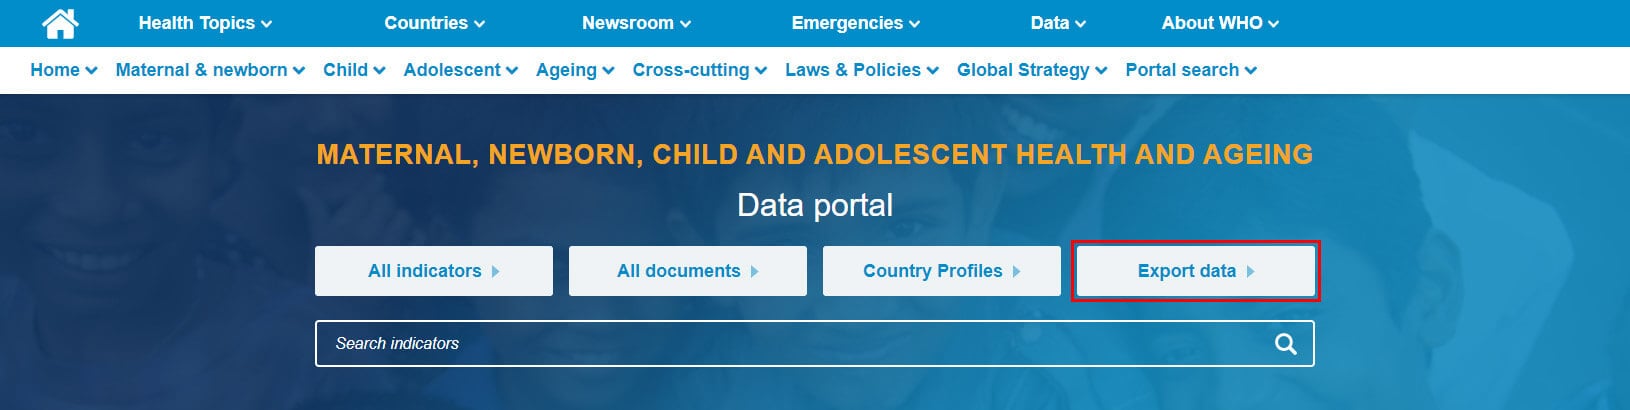
You can reach the dedicated Export Data Page from the front page by pressing this button:
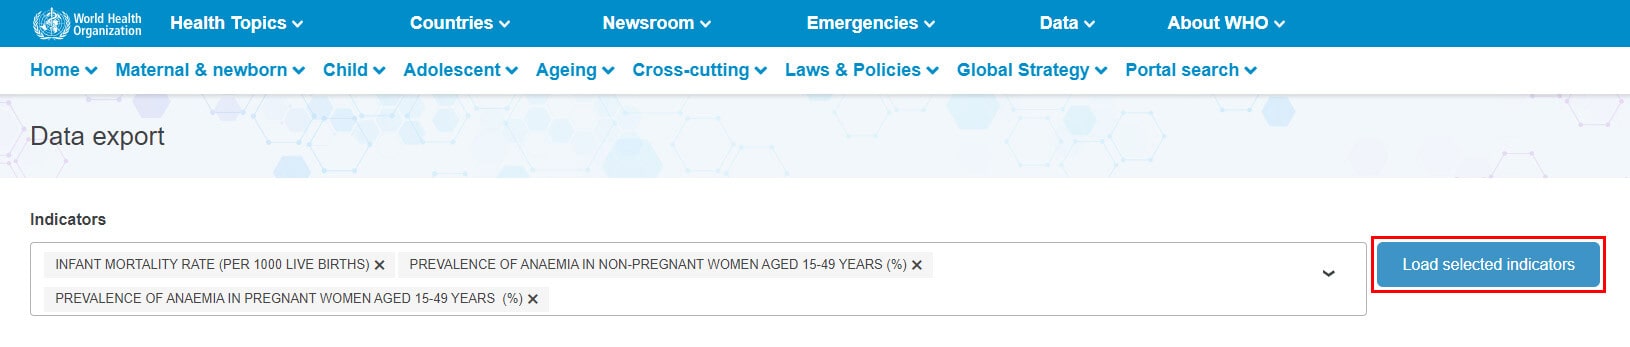
Both methods lead to the same export data page which allows you to search and select indicators in a fashion similar to the "indicator search box" . You can select up to ten (10) indicators at one time.
Once you have selected the indicators you are interested in, please click the blue “Load selected indicators” button:
Once the indicators have been selected, the data will appear in a table along several other features. Like this:
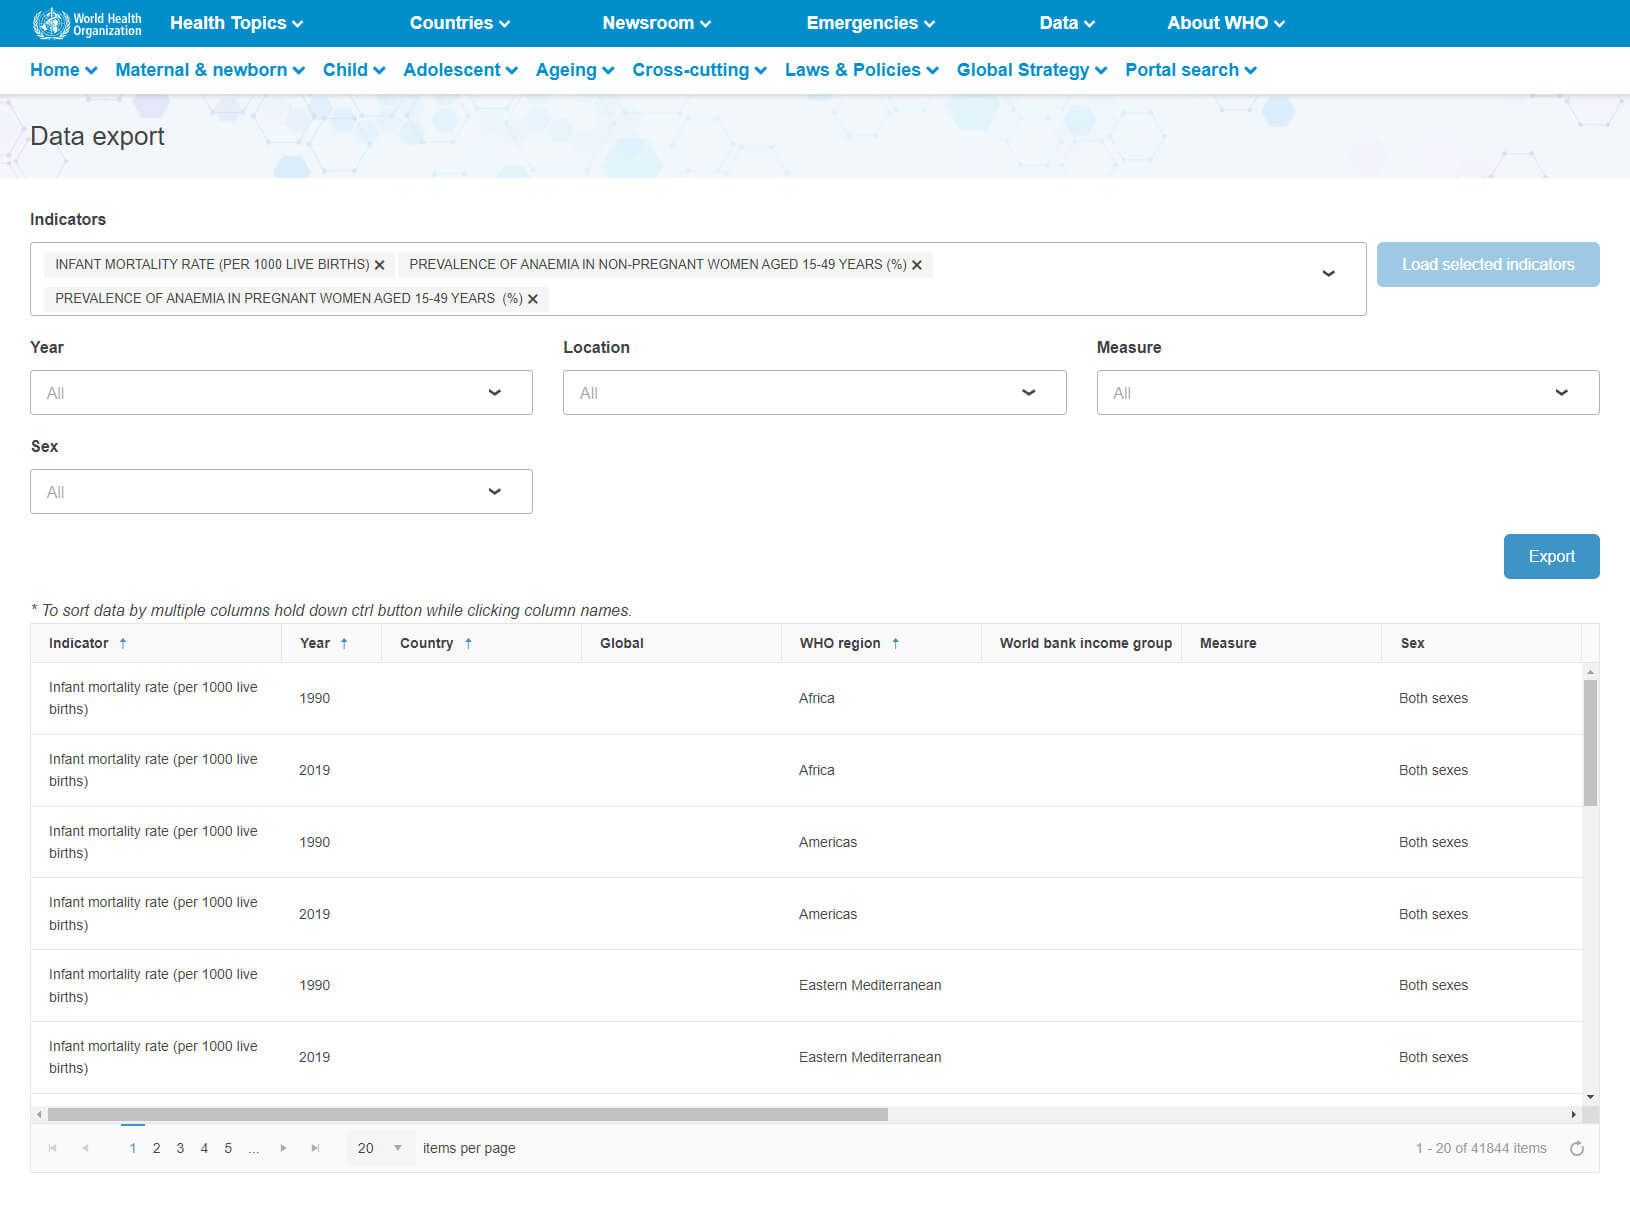
A: This is the “indicator search box”. All indicators (up to 10) will appear here once selected. Remove unwanted indicators with the small “x” by the title and add additional indicators by pressing the small arrow in the right of the search box.
B: Once you have selected the desired indicators press the blue “Load selected indicators” button here and the data will load or reload.
C: These drop-down filters are generated dynamically based on the dimensions of indicators which you have selected. Each filter contains all of the values present for that dimension. When you tick each box, the data ( E) will dynamically reload based on your selection.
C: These drop-down filters are generated dynamically based on the dimensions of indicators which you have selected. Each filter contains all of the values present for that dimension. When you tick each box, the data ( E) will dynamically reload based on your selection.
D: These columns represent all of the indicators’ data based on the selections you have made in previous steps. Generally speaking each row represents the values for one indicator in one geographical area in one year having certain dimensions like sex, age, residence area, etc. The columns are sortable and the direction and sorting of each column are indicated with small up or down arrows representing the direction of the sort. Each column has three possible values that can be cycled through by simply clicking the column name. Those values are “ascending”, “descending” or “not sorted”. Multiple columns can be sorted at the same time.
E: This area displays all of the data for indicators (A), filtered (C) and sorted (D). Please notice that there are scroll bars to the right and below as there will likely be much more data present than can be represented on the screen at the same time.
F: This area allows you to show more items at once or to cycle through the pages of data.
G: Once you are satisfied with the data that have been selected, please push the blue “Export” button. This will generate an excel file with the data and metadata for the indicator(s) that you have selected, filtered and sorted above. There is a limit of 1,000,000 (one million) records per download. If your data request contains more records than that, then please use the filters (C) to reduce the number of rows exported.
How can I export visualizations?
Unfortunately, at this time is it not possible to export the map or chart visualizations except by using your operating systems built in screenshot capabilities. We are working on solutions for this and hope to provide this capability in the future.
How can I find and export documents?
The data portal contains a rich library of national laws, policies, guidelines and other documents related to sexual, reproductive, maternal, newborn, child and adolescent health (SRMNCAH) issues submitted by countries through the WHO SRMNCAH Policy Survey, as well as many important global documents related to the health themes in our data portal. The document search page can be reached on the home page in the two ways highlighted below. The "Portal search" and "Documents" option in the navigation bar are available on every page of the data portal. Additionally, the Laws and & Policies’ Documents section also has the same document functionality present.
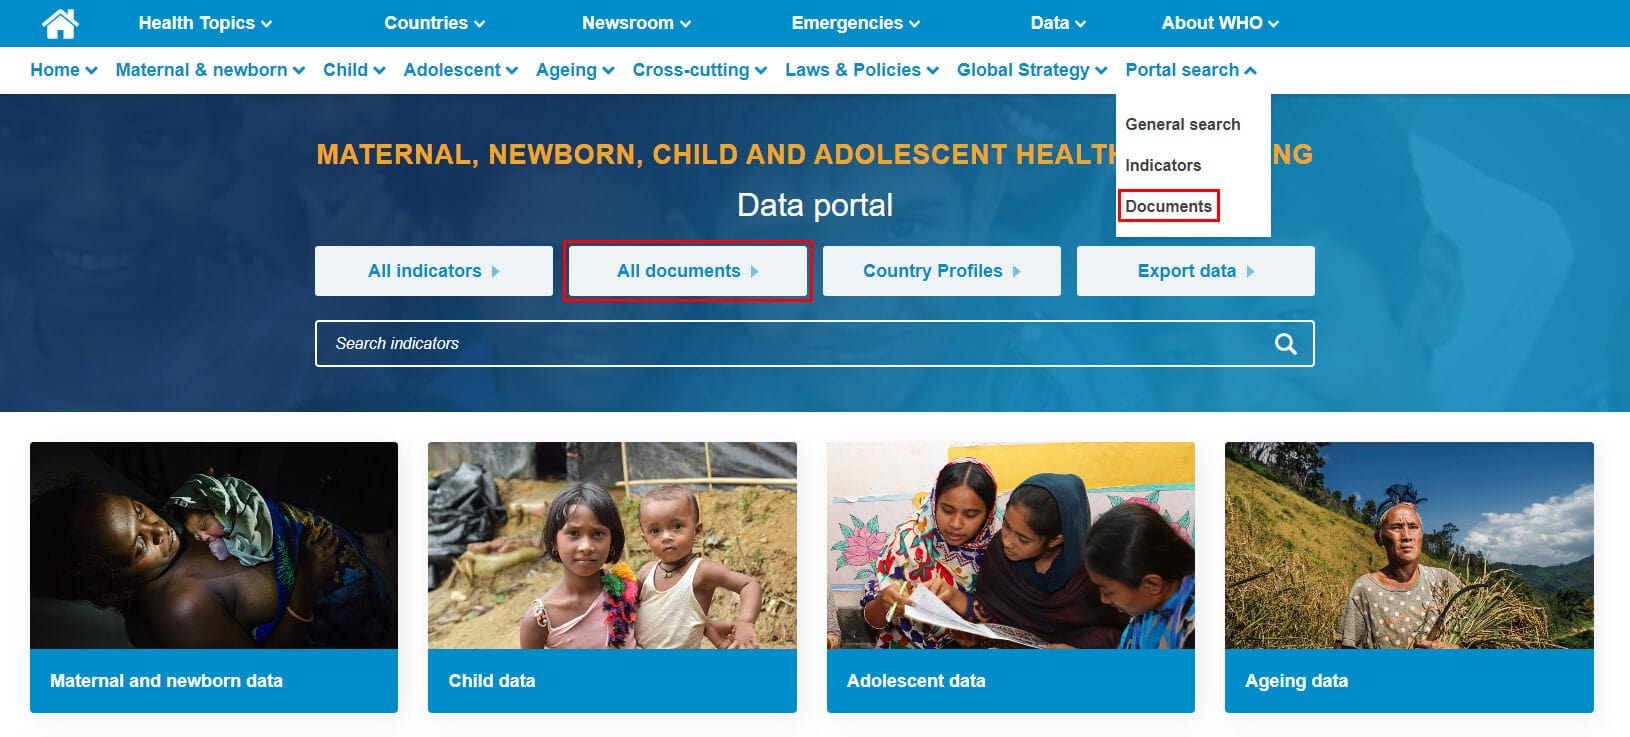
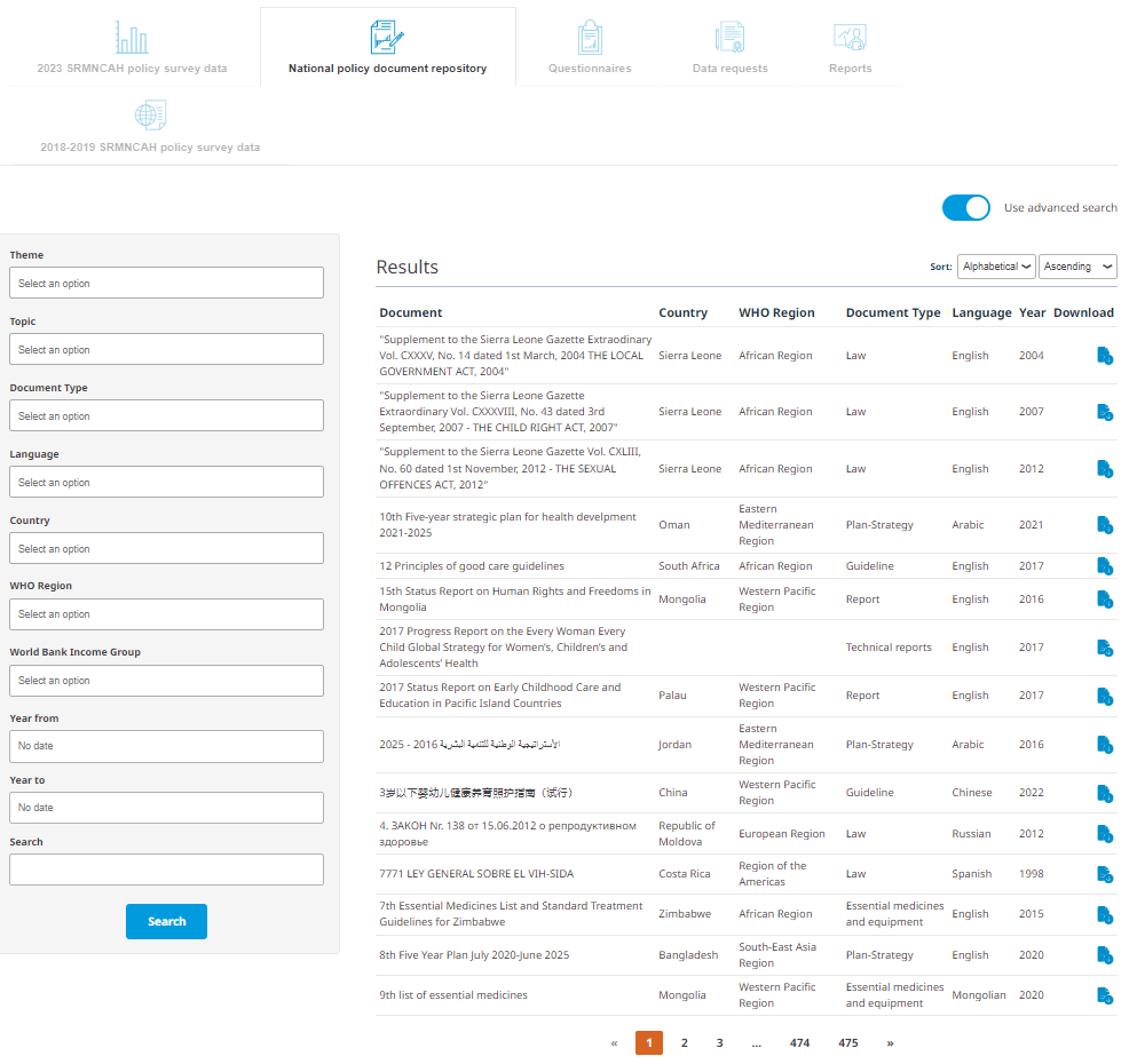
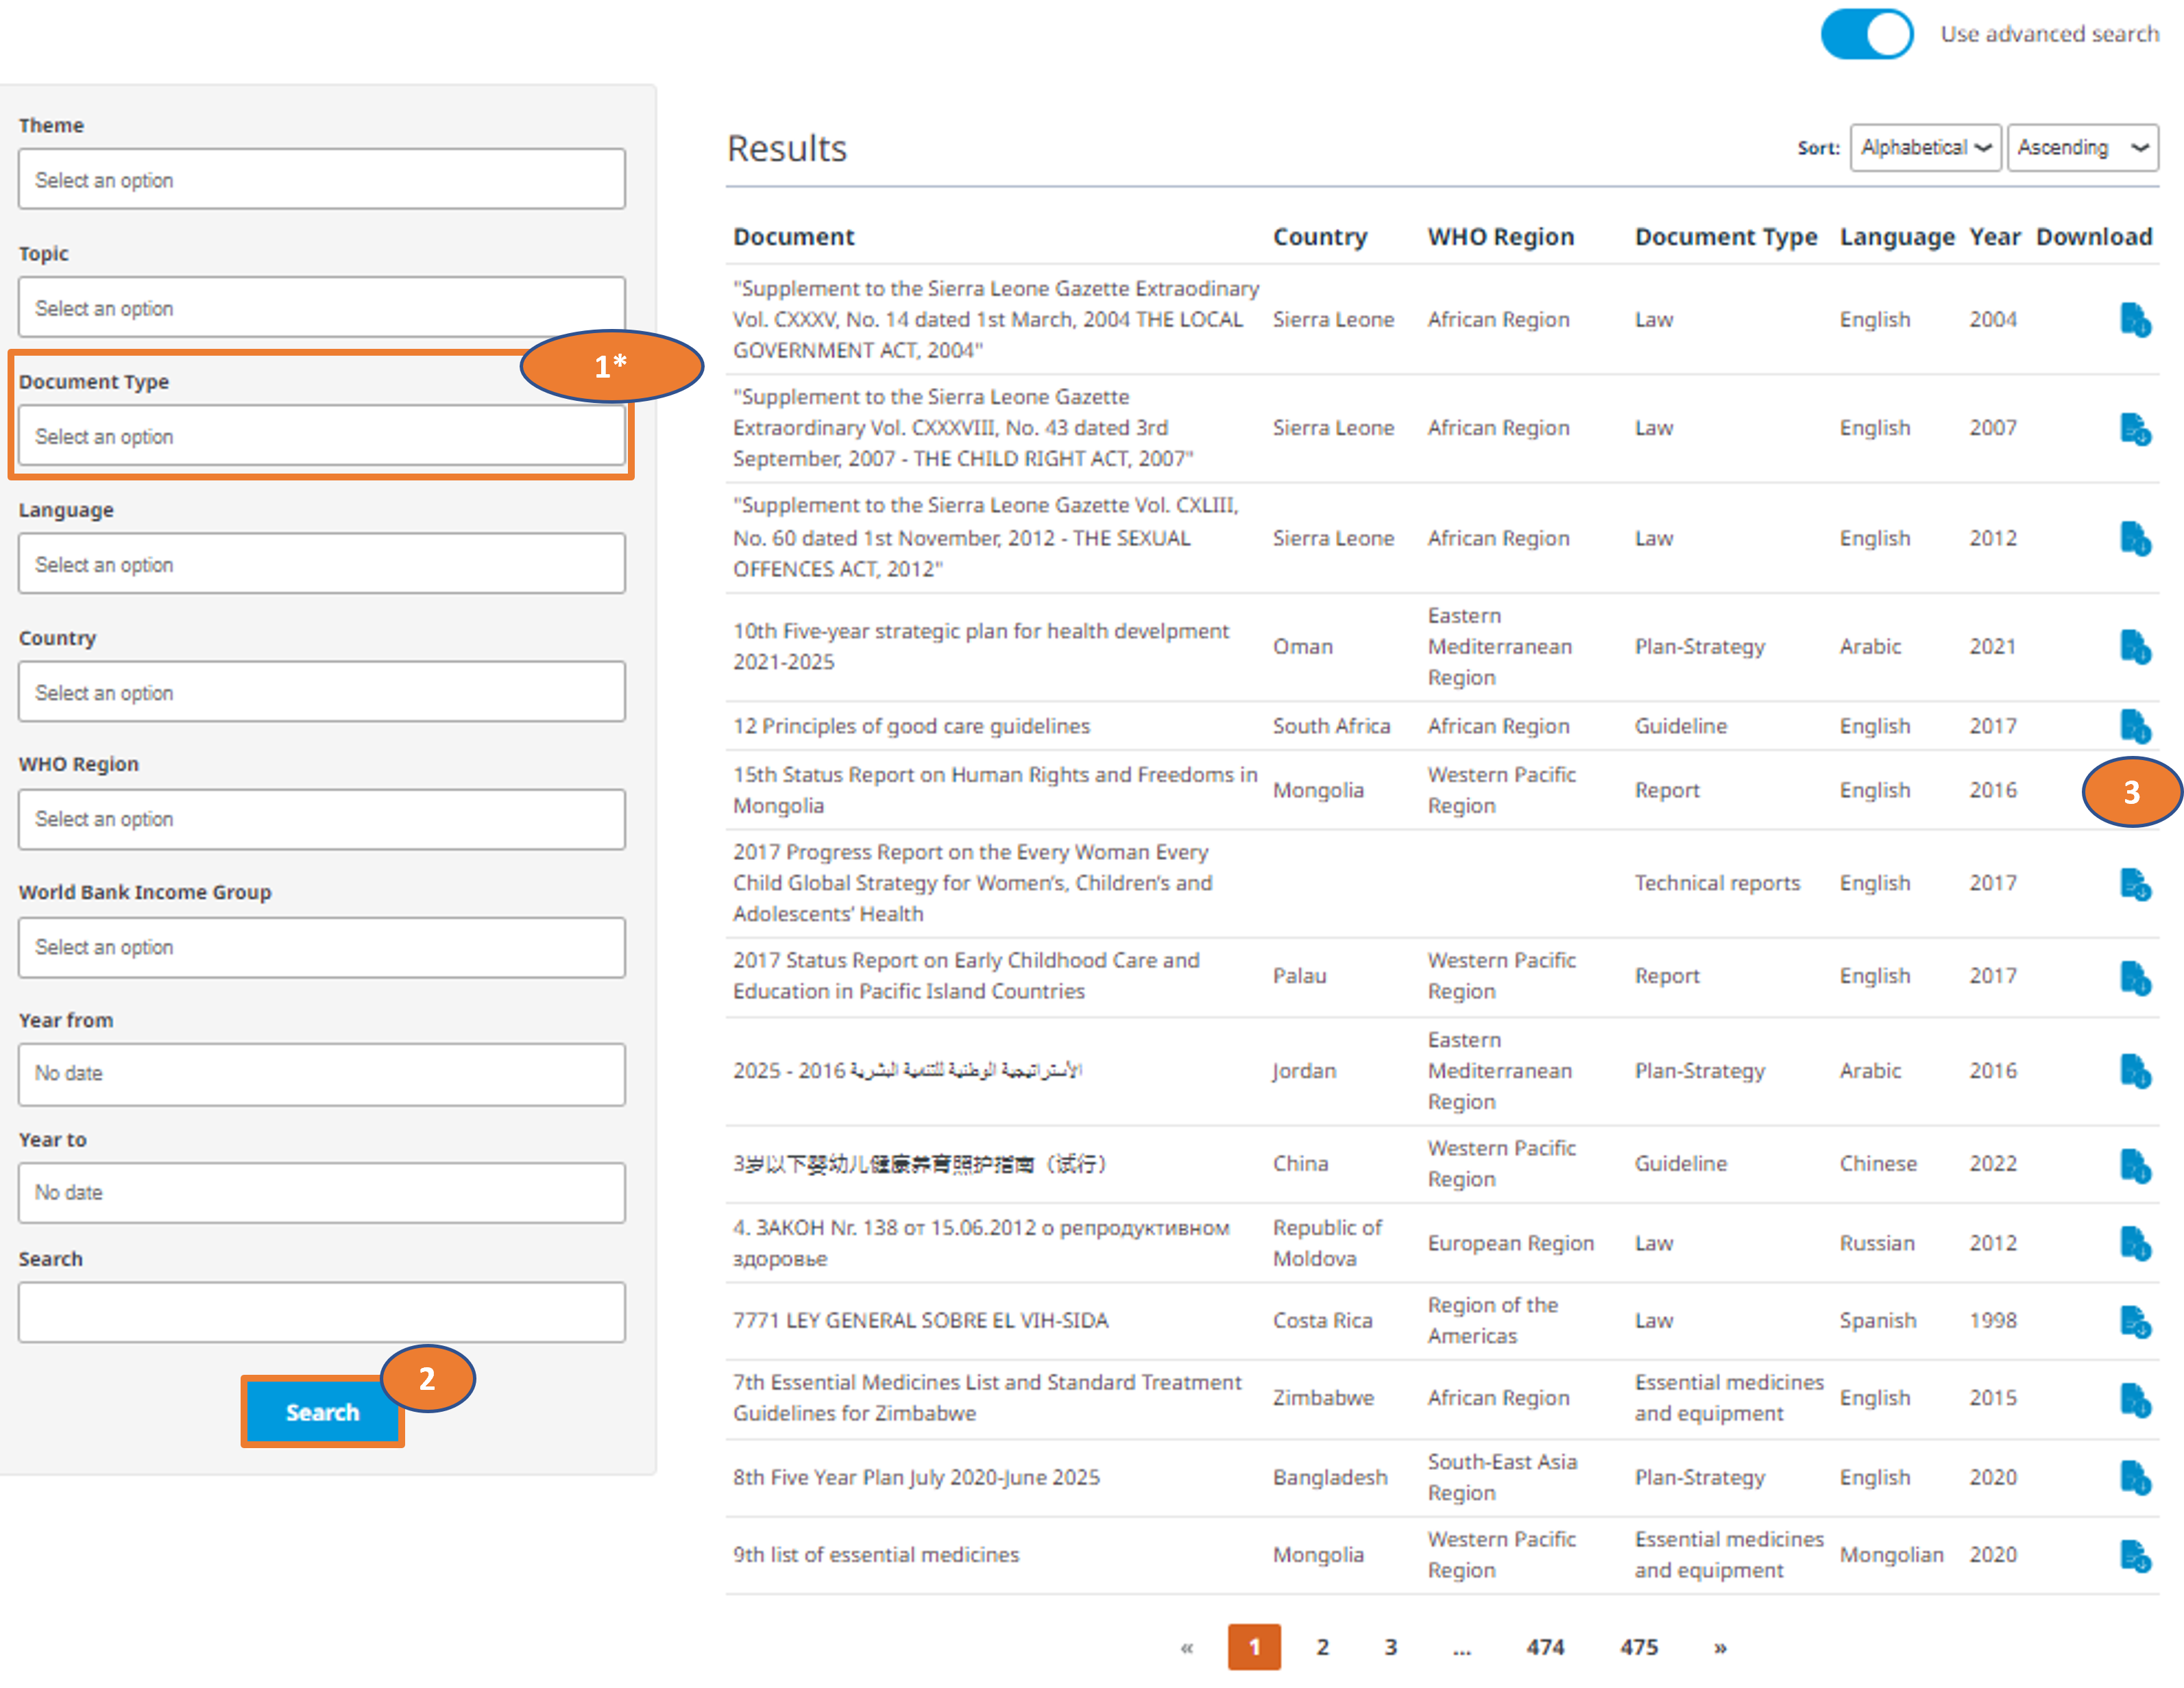
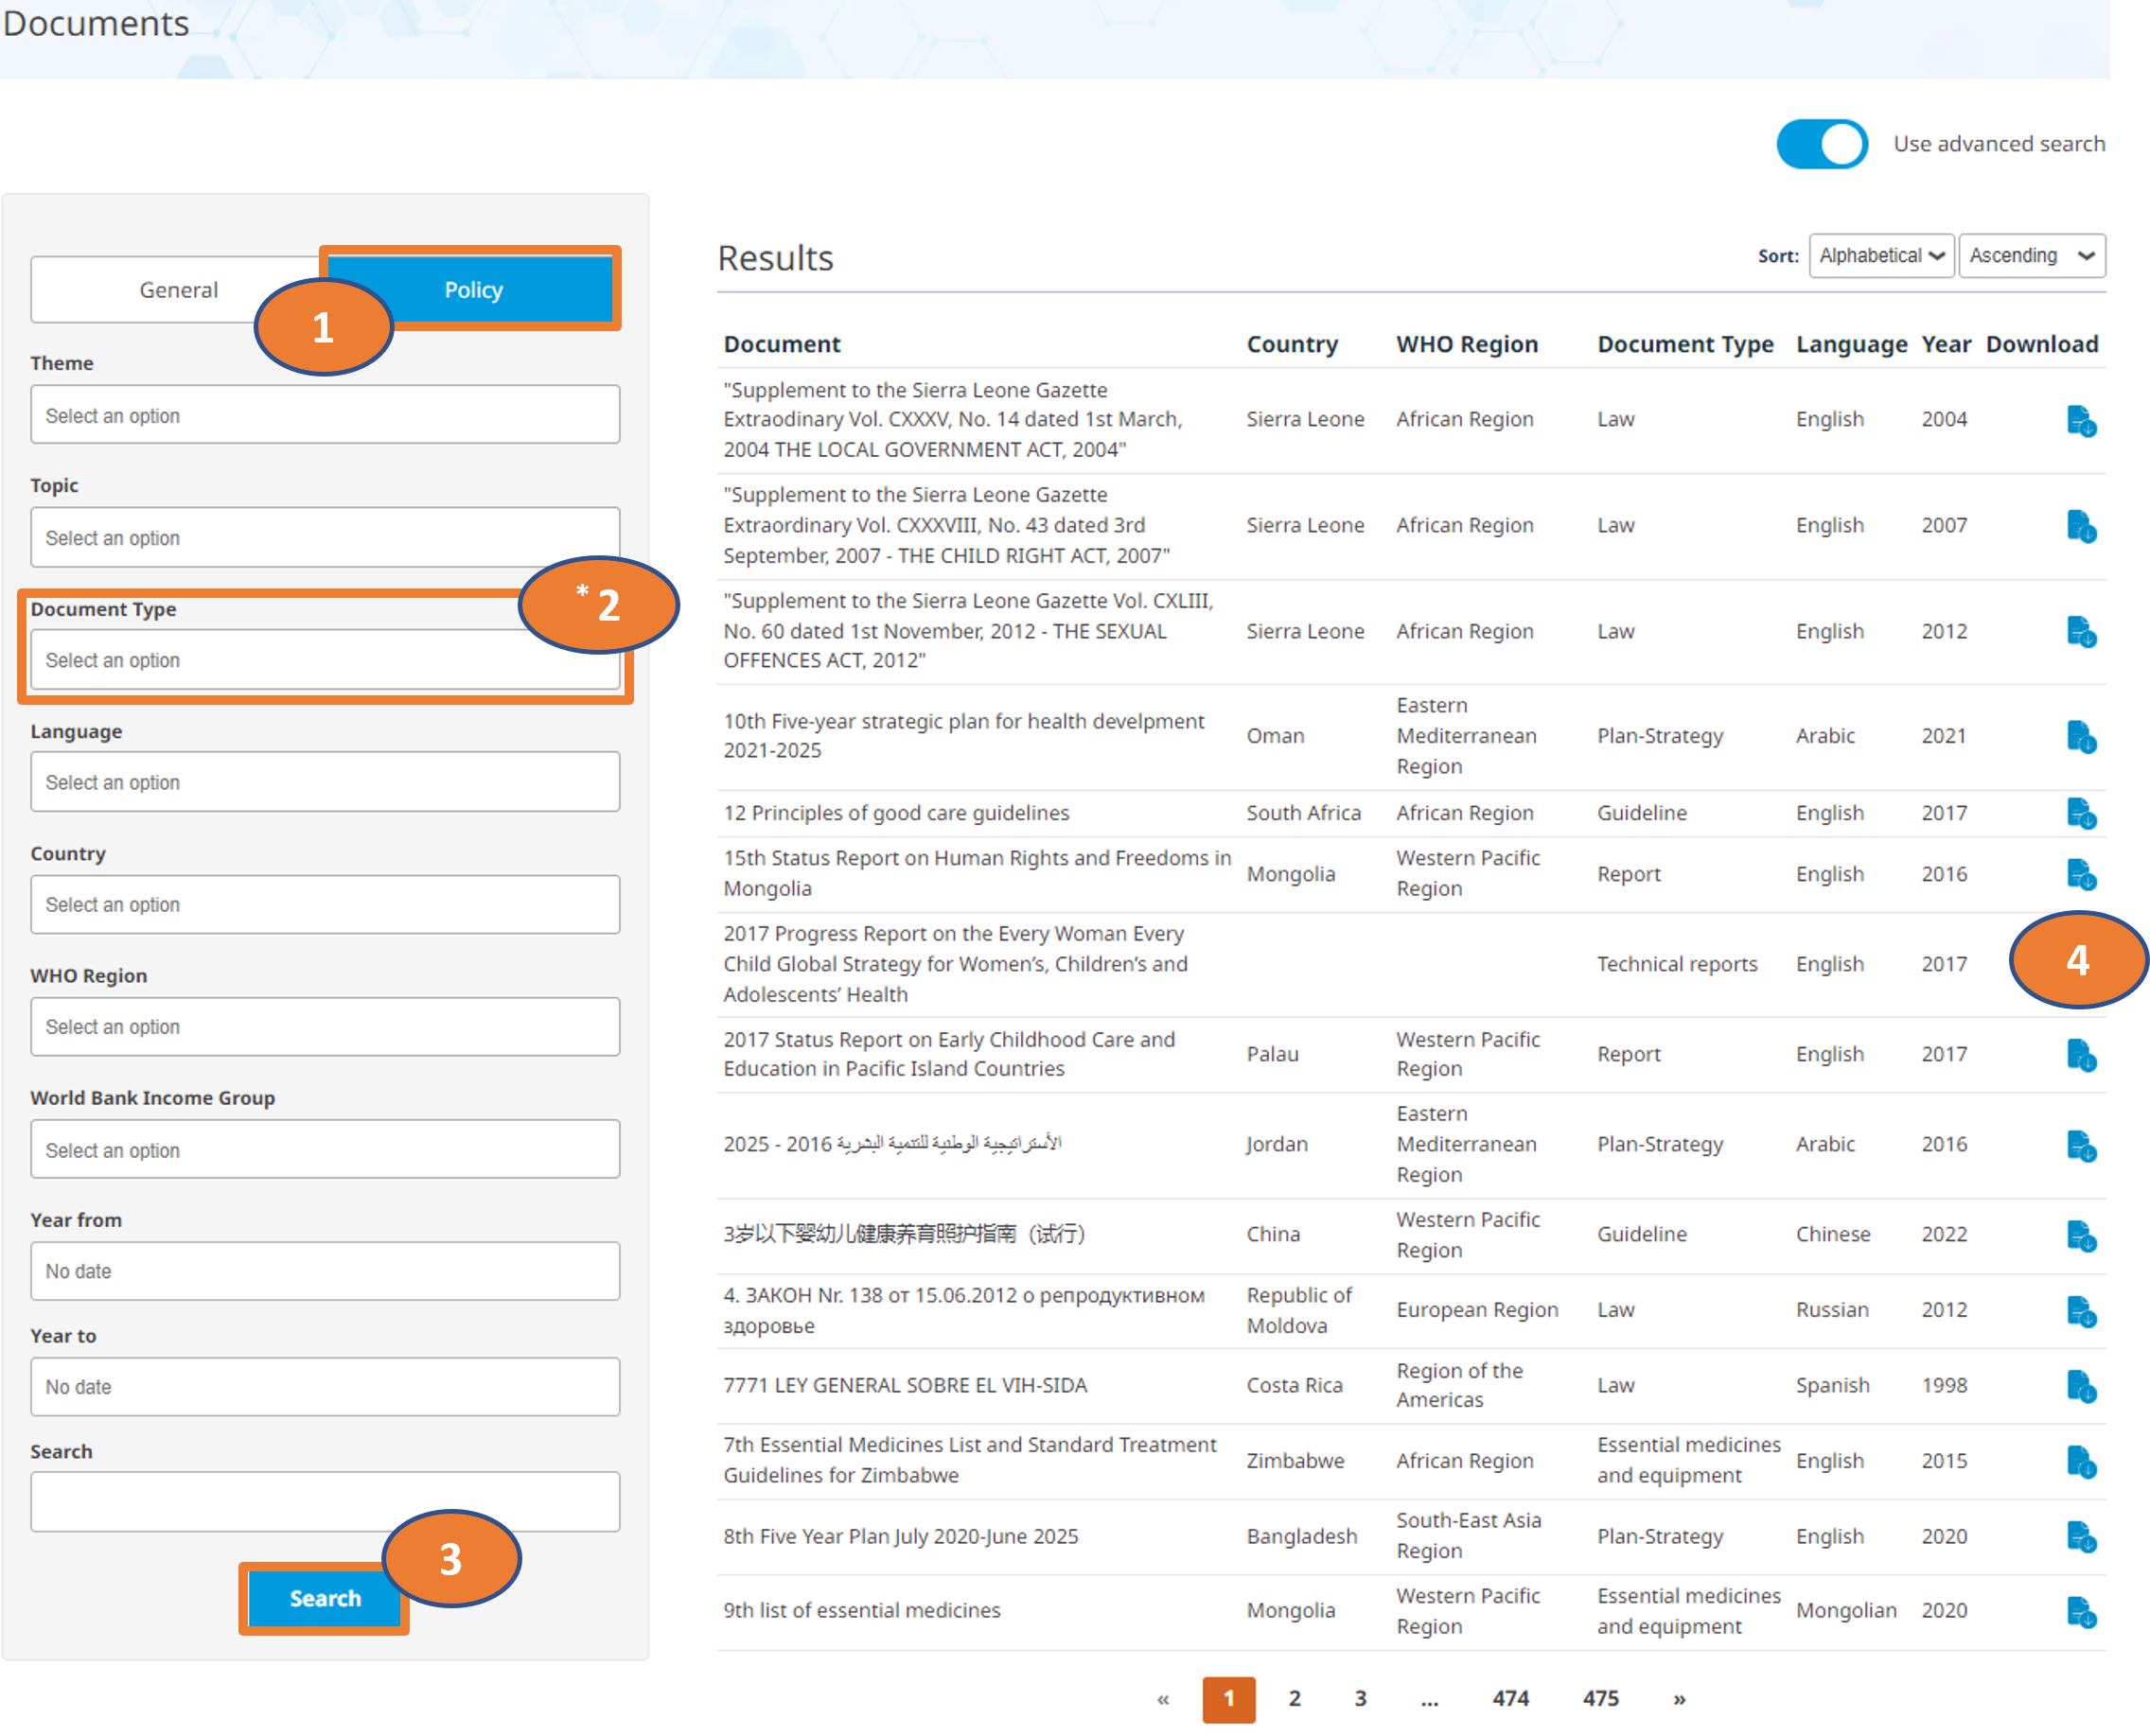
Whether via the Laws and & Policies’ Documents section or the dedicated document search page, the functionality of the document search is essentially the same as shown in the example below:
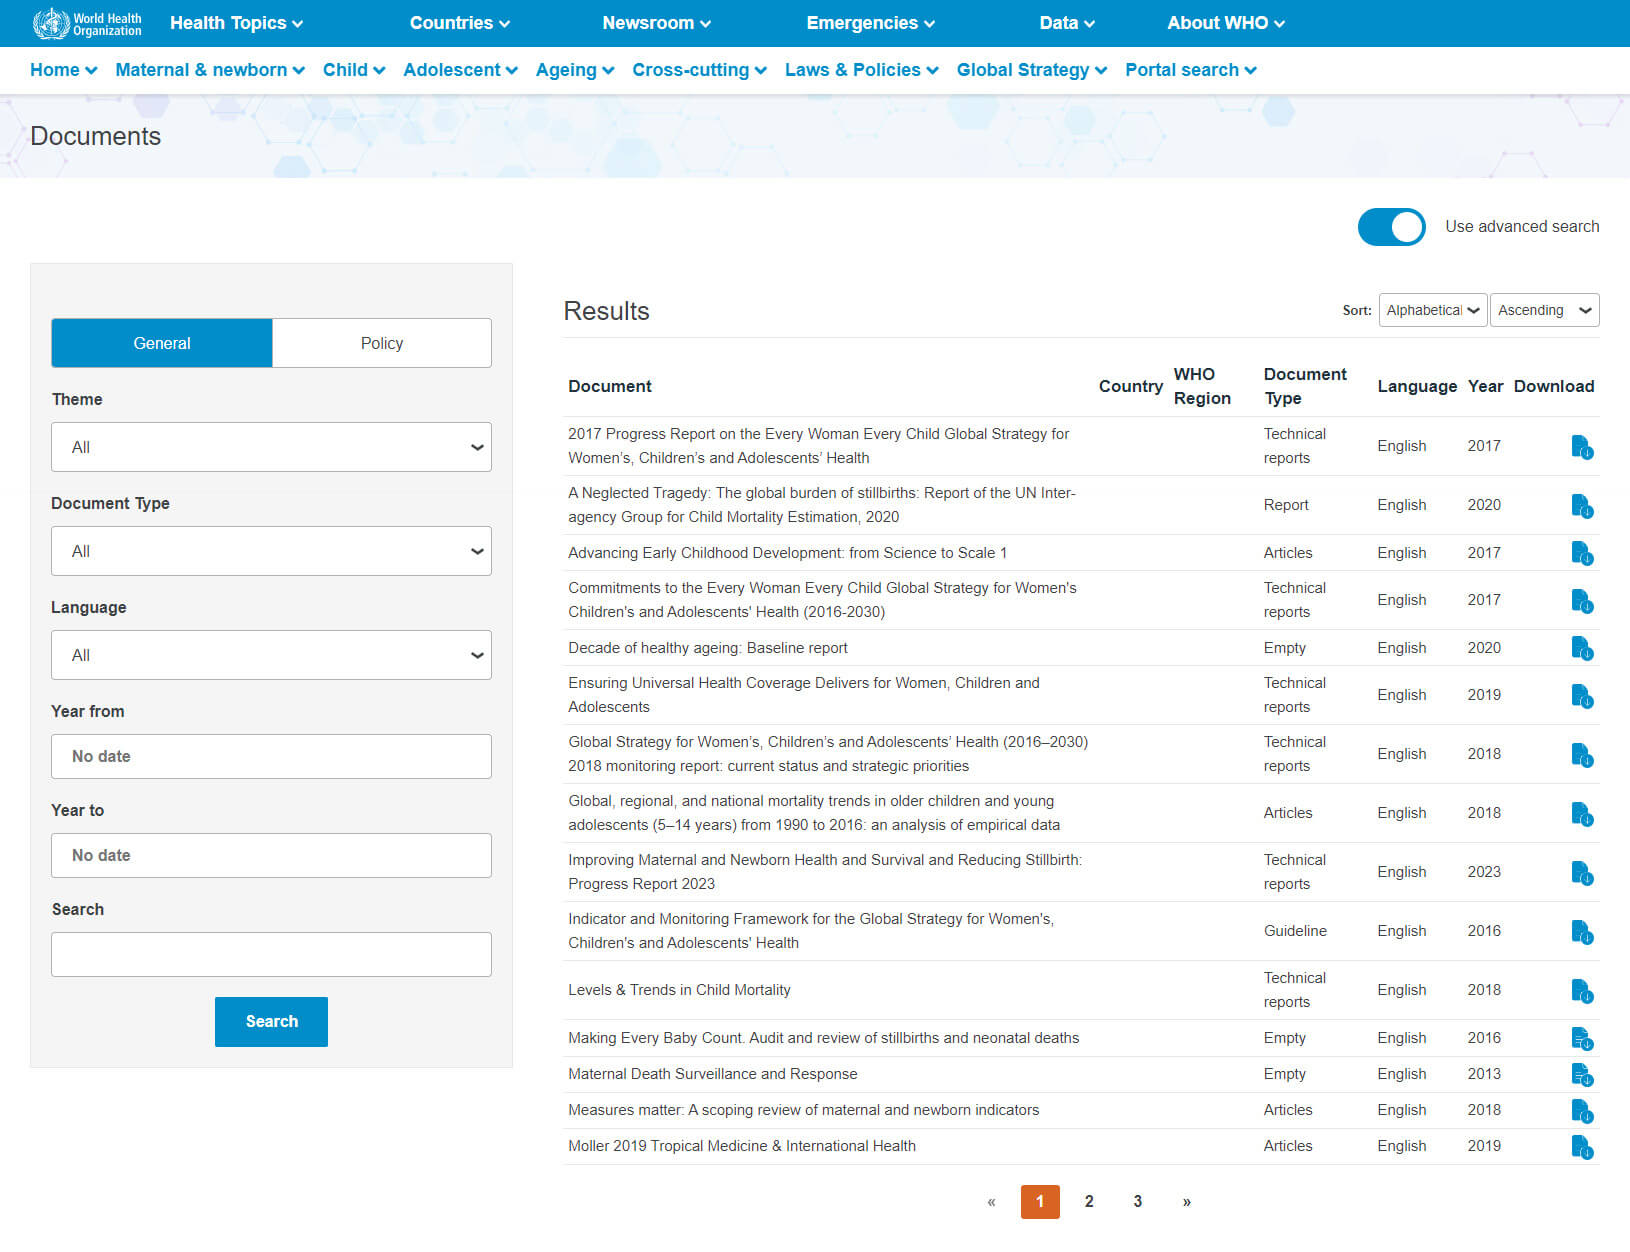
1: Toggle to “ General“ / “Policy“ view of search bar to select which type of document you are searching for.
2: Filter from dropdown menus for custom search (see more detail).
3: Click “Search“
4: Download individual files from “Results“
For a new search, repeat the steps above and remember to click “Search“ to see the filtered results to the right.
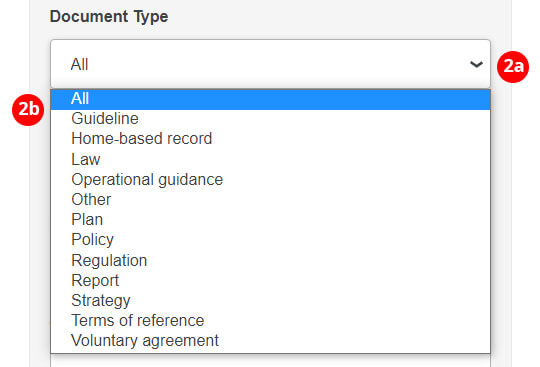
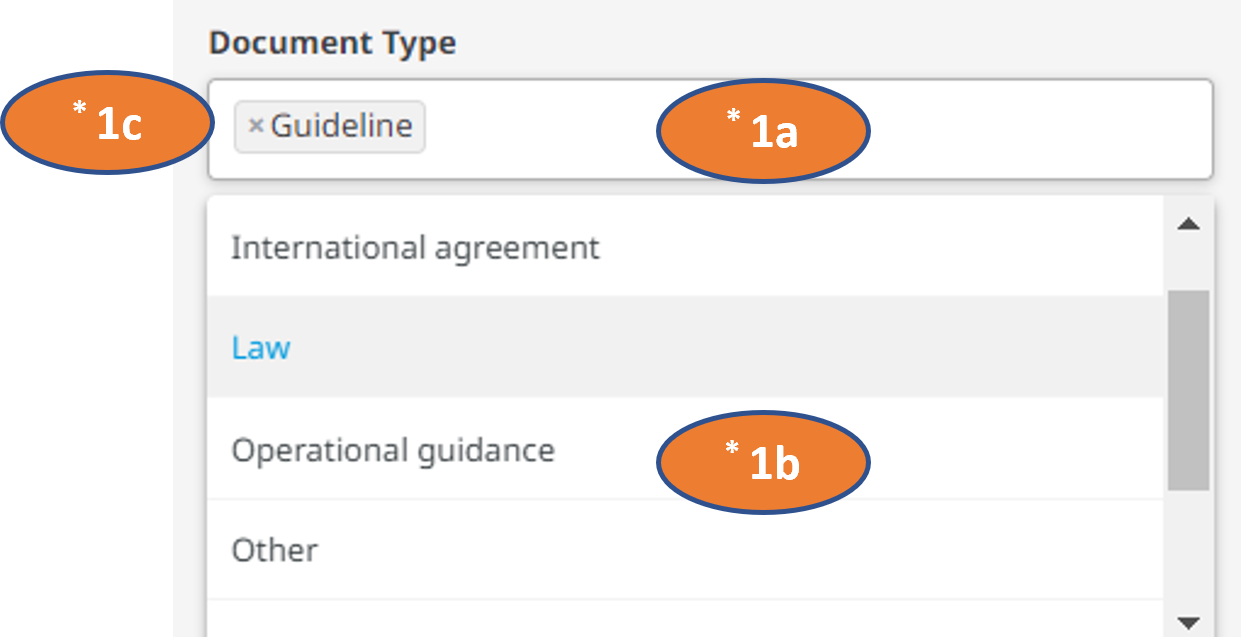
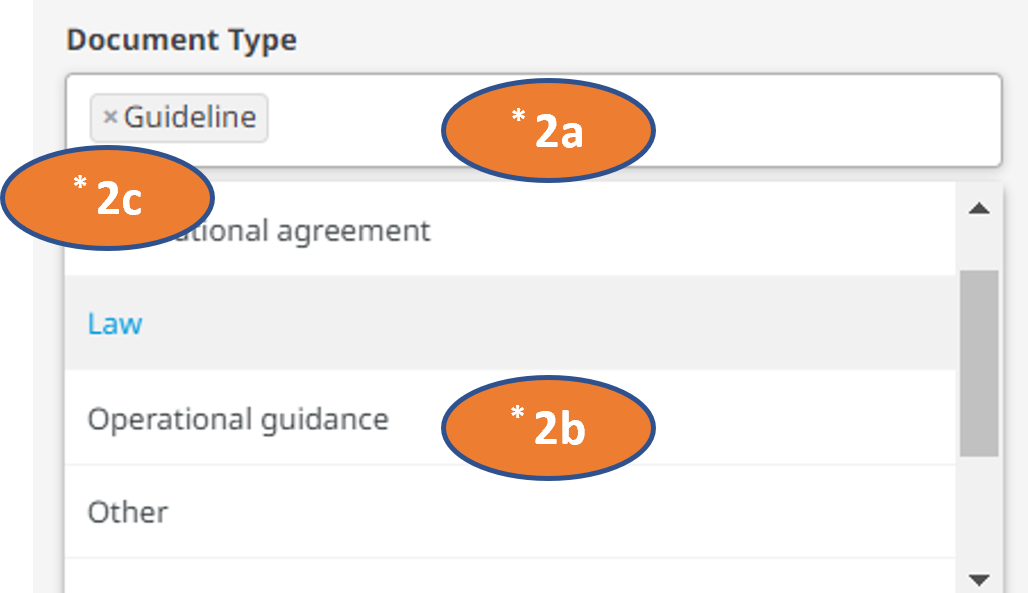
2a: Click on arrow on right of search bar to open menu.
2b: Select item from the dropdown menu.
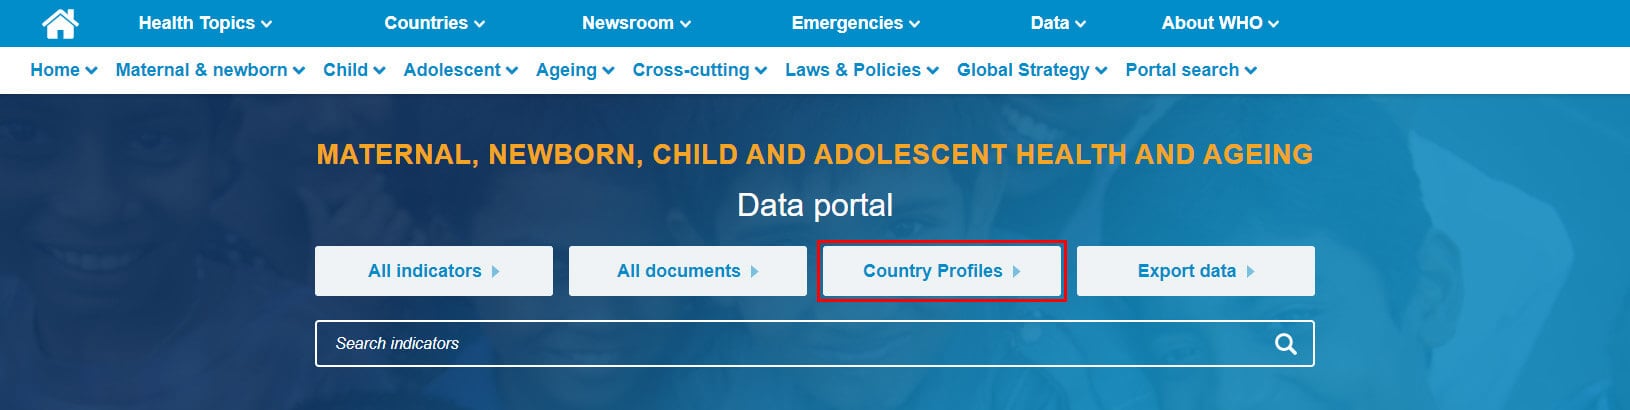
How can I find Country Profiles?
The data portal has several country profiles including ones for adolescent health, ageing, SRMNCAH Policies and the Global Strategy for Women’s, Children’s, and Adolescents’ Health. They can be found on the home page, in the dedicated “Country Profiles“ page, and in the navigation menu.
On the home page the Country profiles are located in two places:
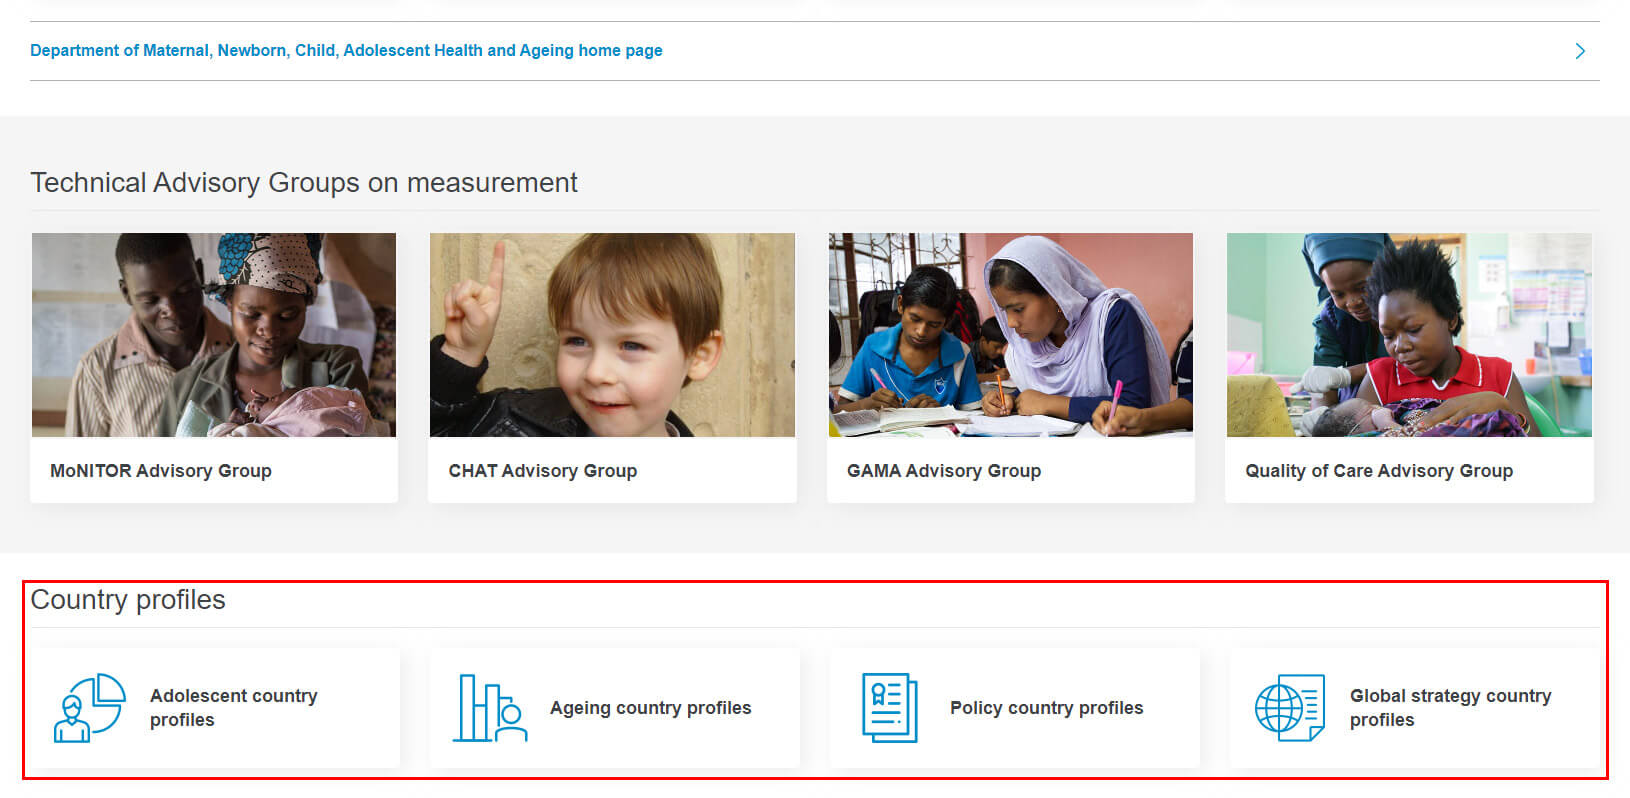
And again towards the bottom of the page:
As mentioned above each of the health themes that has a country profile will also have that country profile listed in the navigation menu that is always present in the data portal. For example, for the “Adolescent country profiles“:
How do the country profiles work and how can I export them?
While there are several different country profiles available through the portal, they can each be accessed and exported the same way.
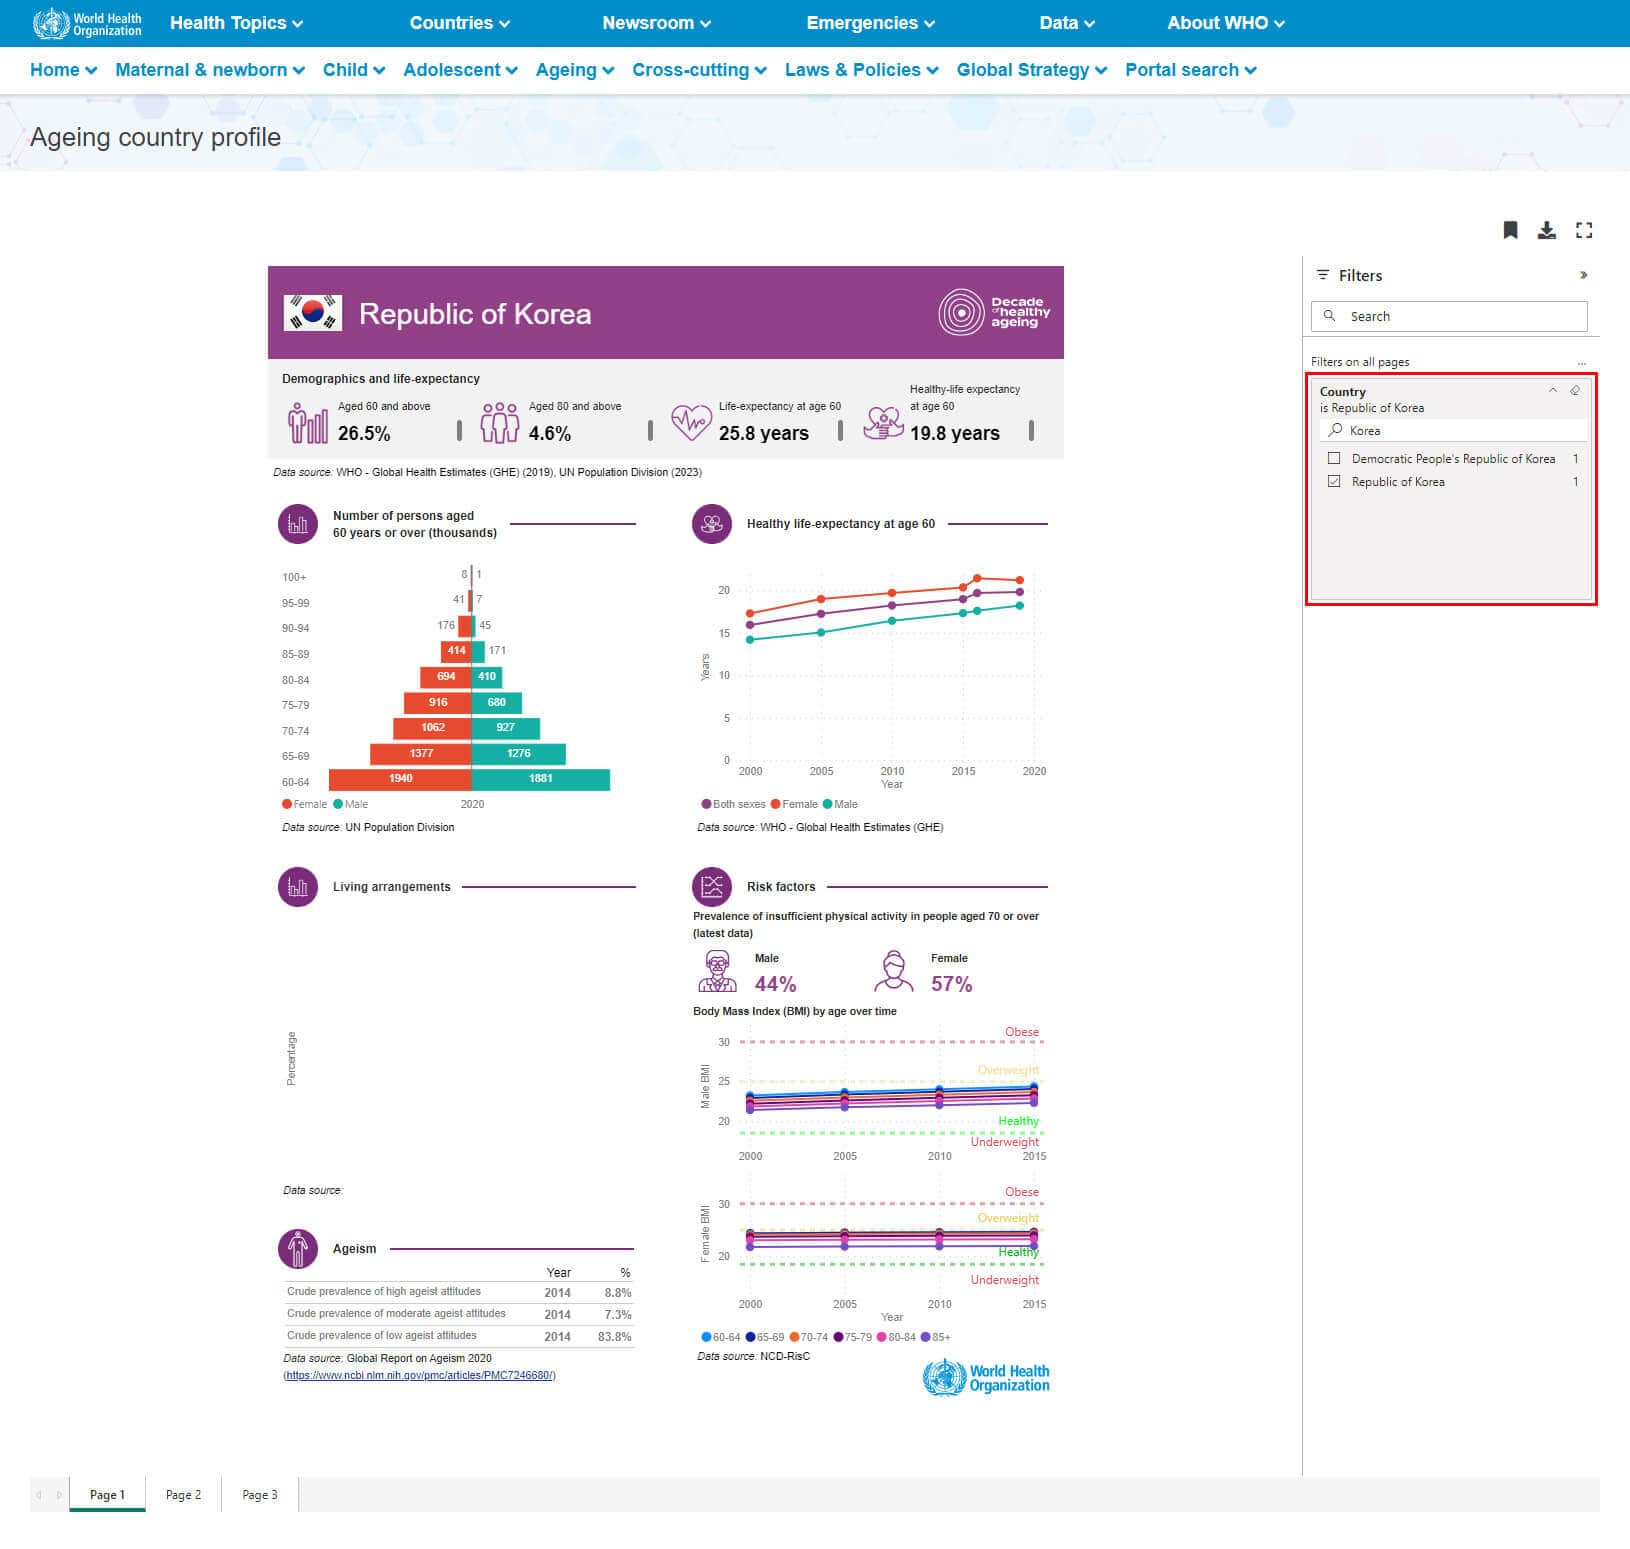
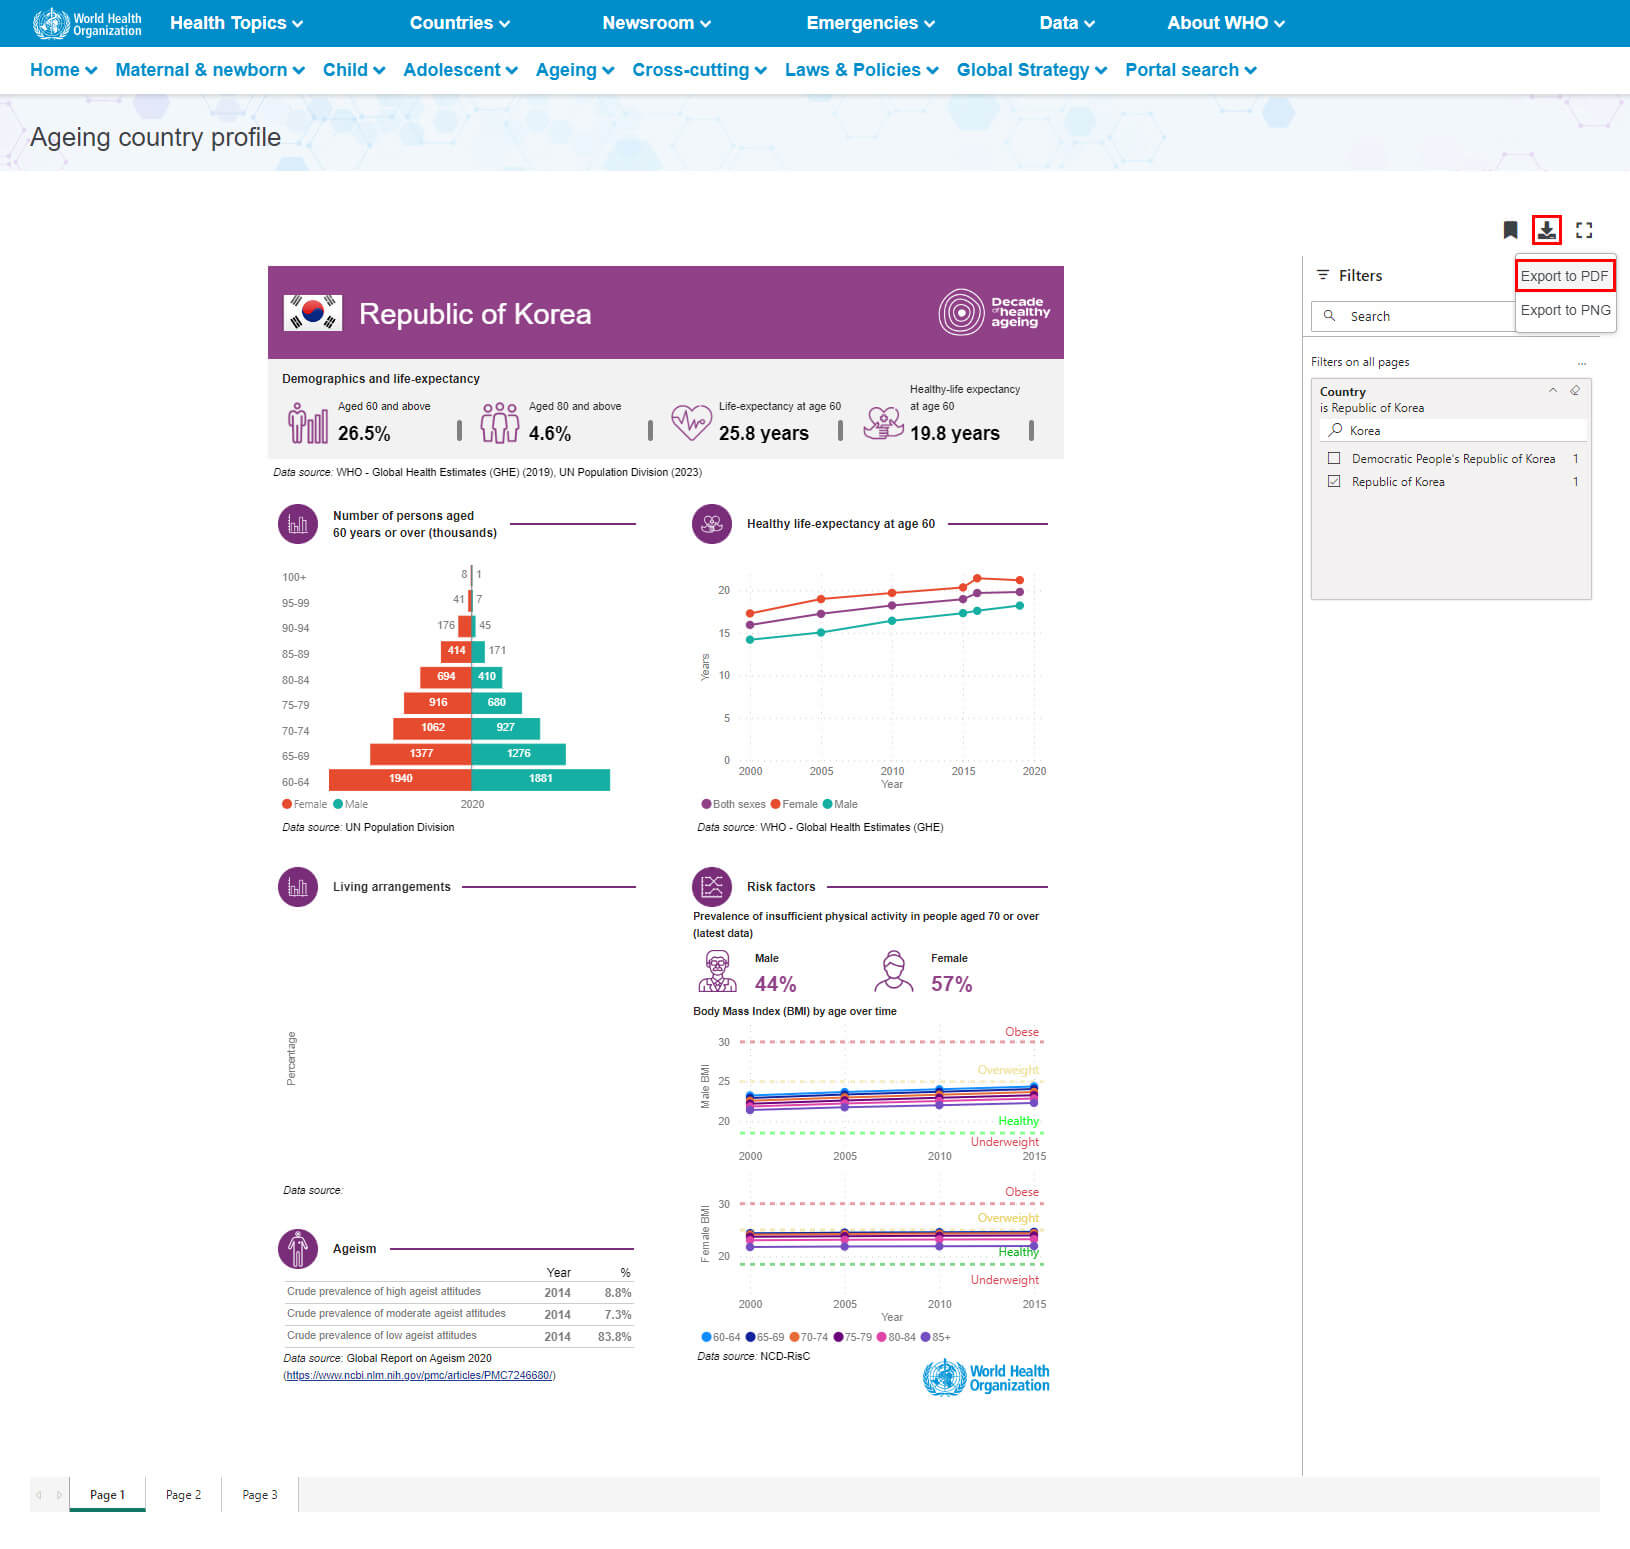
Using the ageing profile as an example we will show both functions. First, only one country can be selected at time for these profiles. This is done using the search box and filter on the right side of the page like this:
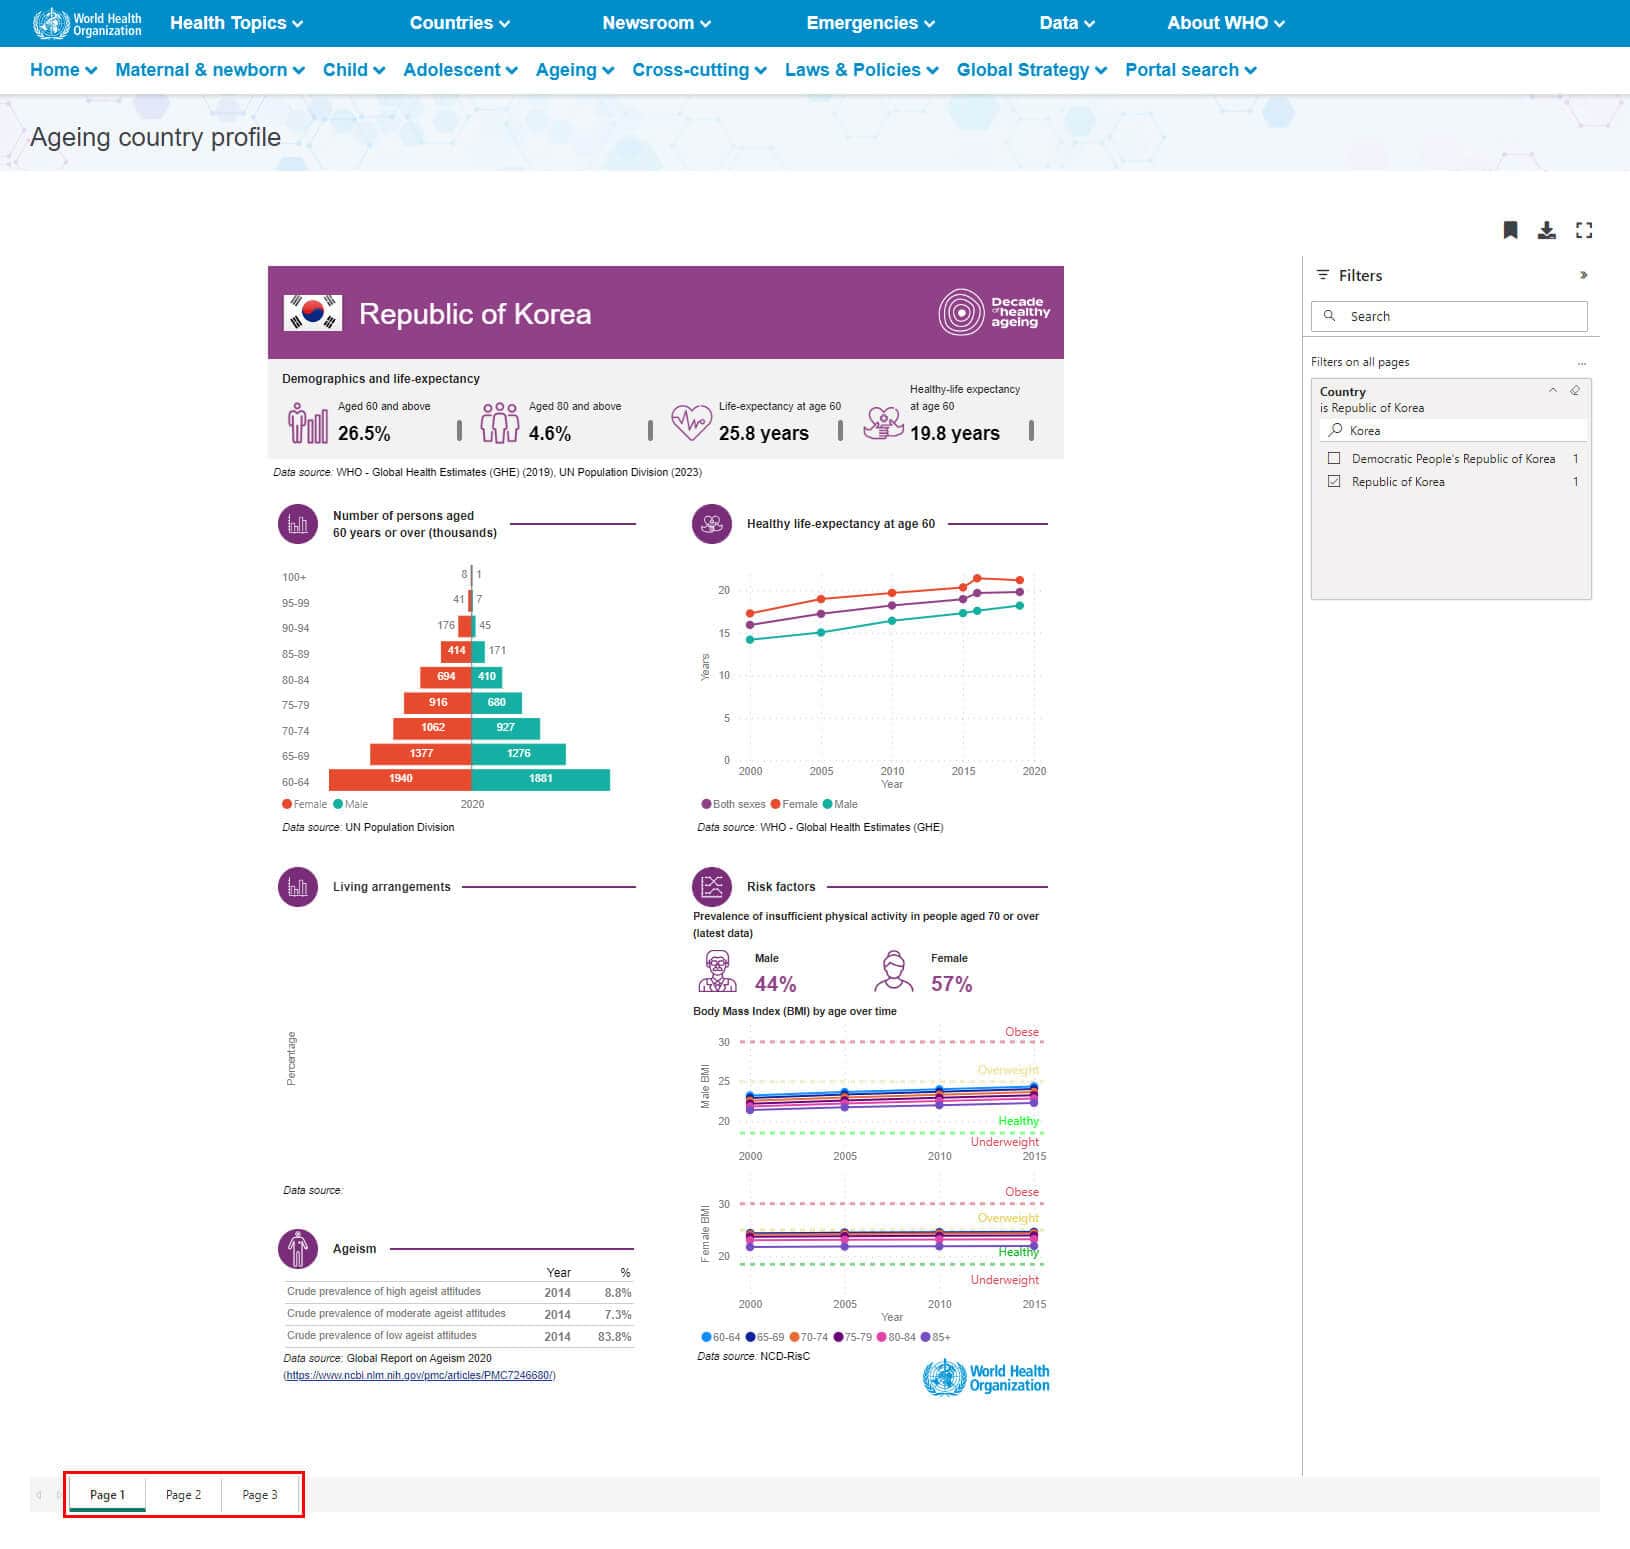
Please note that most of the country profiles have multiple pages which can be navigated to by using the page view control at the bottom of the profile as shown here:
Once your desired country has been selected, you can print or export your report. Please press the download icon and then select “Export to PDF”. This function will print or export the entire report regardless of what page is currently visible on the screen. An example is shown here:
What is in the SRMNCAH national policy document repository?
The WHO sexual, reproductive, maternal, newborn, child and adolescent health (SRMNCAH) national policy document repository includes over 6,500 documents from approximately 140 countries submitted through the 2018-2019 and 2023 rounds of the WHO SRMNCAH Policy Survey.
- The documents were submitted by national survey respondents and were organized and catalogued by the WHO Department of Maternal, Newborn, Child and Adolescent Health and Ageing
Search filters allow users to find documents under various health topics by country, document type, year of publication, language, etc.
How do I access the SRMNCAH national policy document repository with a direct link?
Step 1: Use dropdown menus to filter for custom searches
Step 2: Click Search
Step 3: Download individual files from Results
For a new search, repeat the steps above and remember to click Search again to see the filtered results to the right.
How do I access the SRMNCAH national policy document repository from the MNCAAH data portal homepage?
Go to https://platform.who.int/data/maternal-newborn-child-adolescent-ageing
Select Laws & Policies from the menu across the top (A) OR select All documents (B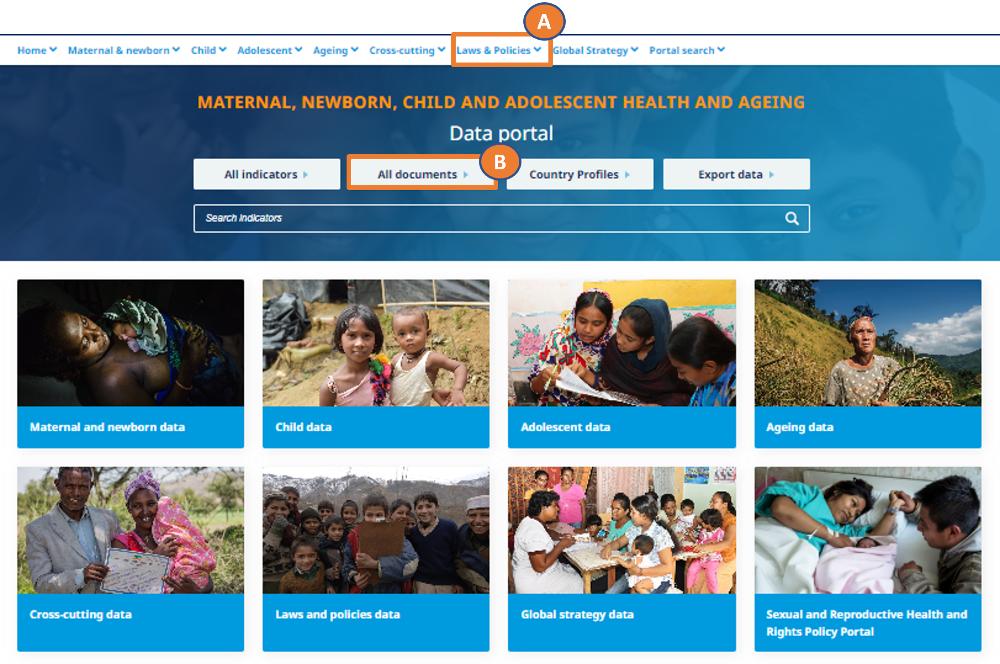
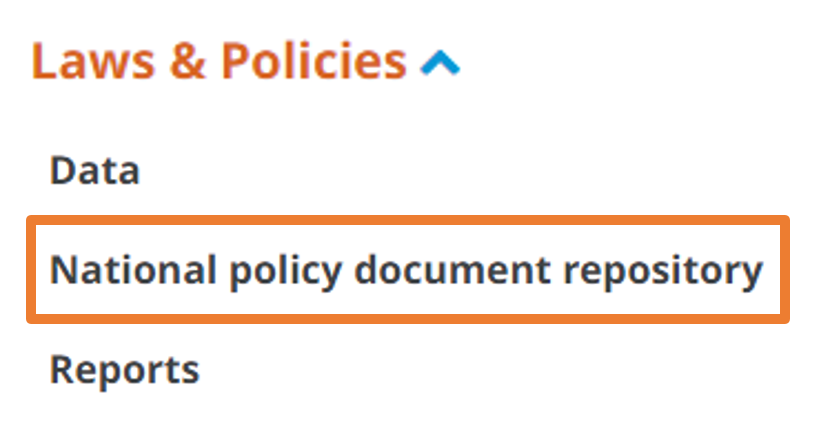
If accessing the repository through Laws & Policies (A), open the dropdown menu (using the small arrow) and select National policy document repository.
Step 1: Toggle to Policy view of search bar
Step 2: Use dropdown menus to filter for custom searches
Step 3: Click Search
Step 4: Download individual files from Results
For a new search, repeat the steps above and remember to click Search again to see the filtered results to the right.
What can I do if I still have a problem?
If you still have a problem with the data portal, please contact mncahdata@who.int for further assistance.